Exhibit (a)(5)(c)
Confidential Project Volt Fairness Opinion 16 June 2024
Exhibit (a)(5)(c)
Confidential Project Volt Fairness Opinion 16 June 2024
Disclaimer The following materials are confidential and have been prepared by UBS Securities LLC (“UBS”) for the Transaction
Committee of the Board of Directors of Allego N.V. (the “Company”) using financial information supplied by, or on behalf of the Company and other publicly available information. This material does not purport to contain all information
that may be required for the Company to make a decision on a potential transaction or strategy and the Company should not rely upon the materials in making such a decision. This material was prepared for a specific use by the Company and was not
prepared with a view to public disclosure or to conform with any disclosure standards under securities laws or otherwise. The Company should not construe the contents of these materials as legal, tax, accounting or investment advice.
It should be understood that any estimates, valuations and/or projections contained in the accompanying material were prepared or derived from information supplied by the Company
and public sources without the assumption by UBS of responsibility for any independent verification thereof. Accordingly, neither UBS nor any of its officers, directors, employees, affiliates, advisors, agents or representatives warrants the
accuracy or completeness of any such information, including, without limitation, the accuracy or achievability of any such estimates, valuations and/or projections. Actual results may vary from such estimates, valuations and/or projections and such
variations may be material. The contents of these materials are based upon conditions as they existed and could be evaluated as of the date hereof and except where otherwise indicated, speak as of the date hereof. By delivering these materials, UBS
does not undertake any obligation to update any of the information or the conclusions contained herein or to correct any inaccuracies which may become apparent. These materials do not constitute an opinion by UBS as to the fairness to the Company or
its shareholders of the terms of any actual or proposed transaction involving the Company.
This material may not be copied, reproduced, distributed or provided to
any person other than the Company at any time without the prior written consent of UBS.
© UBS 2024. The key symbol and UBS are among the registered and
unregistered trademarks of UBS. All rights reserved.
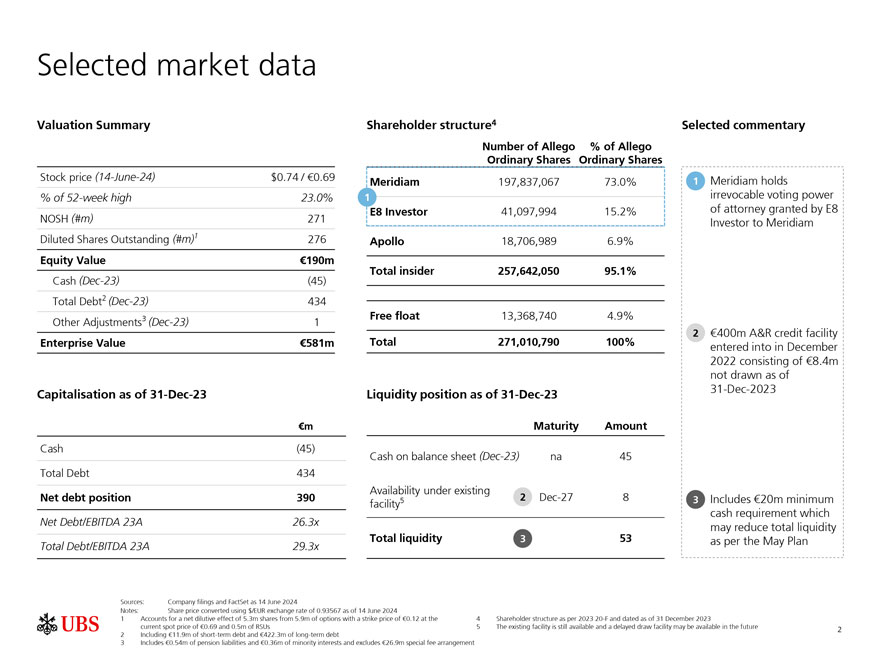
Selected market data Valuation Summary Shareholder structure4 Selected commentary Number of Allego % of Allego Ordinary Shares Ordinary Shares Stock price (14-June-24) $0.74 / €0.69 Meridiam Meridiam 197,837,067 73.0% 1ï,— holds % of 52-week high 23.0% 1 irrevocable voting power NOSH (#m) 271 E8 Investor 41,097,994 15.2% of attorney granted by E8 Investor to Meridiam Diluted Shares Outstanding (#m)1 276 Apollo 18,706,989 6.9% Equity Value €190m Total insider 257,642,050 95.1% Cash (Dec-23) (45) Total Debt2 (Dec-23) 434 3 Free float 13,368,740 4.9% Other Adjustments (Dec-23) 1 2ï,— €400m A&R credit facility Enterprise Value €581m Total 271,010,790 100% entered into in December 2022 consisting of €8.4m not drawn as of Capitalisation as of 31-Dec-23 Liquidity position as of 31-Dec-23 31-Dec-2023 €m Maturity Amount Cash (45) Cash on balance sheet (Dec-23) na 45 Total Debt 434 Availability under existing Net debt position 390 5 2 Dec-27 8 3ï,— Includes €20m minimum facility cash requirement which Net Debt/EBITDA 23A 26.3x may reduce total liquidity Total liquidity 3 53 as per the May Plan Total Debt/EBITDA 23A 29.3x Sources: Company filings and FactSet as 14 June 2024 Notes: Share price converted using $/EUR exchange rate of 0.93567 as of 14 June 2024 1 Accounts for a net dilutive effect of 5.3m shares from 5.9m of options with a strike price of €0.12 at the 4 Shareholder structure as per 2023 20-F and dated as of 31 December 2023 current spot price of €0.69 and 0.5m of RSUs 5 The existing facility is still available and a delayed draw facility may be available in the future 2 2 Including €11.9m of short-term debt and €422.3m of long-term debt 3 Includes €0.54m of pension liabilities and €0.36m of minority interests and excludes €26.9m special fee arrangement
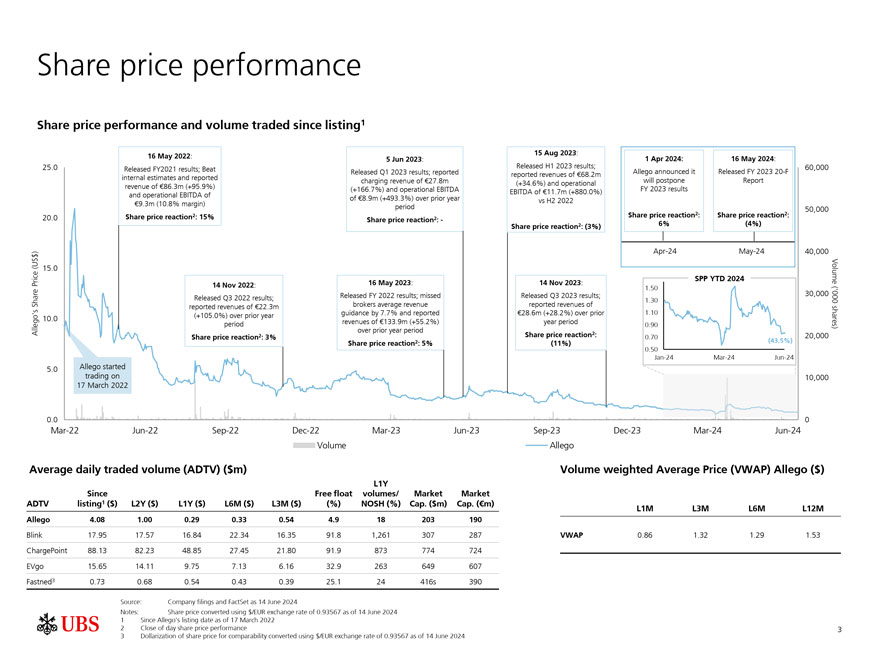
Share price performance Share price performance and volume traded since listing1 16 May 2022: 15 Aug 2023: 5 Jun 2023: 1 Apr 2024: 16 May 2024: 25.0 Released FY2021 results; Beat Released H1 2023 results; 60,000 internal estimates and reported Released Q1 2023 results; reported reported revenues of €68.2m Allego announced it Released FY 2023 20-F revenue of €86.3m (+95.9%) charging revenue of €27.8m (+34.6%) and operational will postpone Report and operational EBITDA of (+166.7%) and operational EBITDA EBITDA of €11.7m (+880.0%) FY 2023 results of €8.9m (+493.3%) over prior year vs H2 2022 €9.3m (10.8% margin) period 50,000 Share price reaction2: 15% Share price reaction2: Share price reaction2: 20.0 Share price reaction2: -Share price reaction2: (3%) 6% (4%) Apr-24 May-24 40,000 Volume 15.0 SPP YTD 2024 14 Nov 2022: 16 May 2023: 14 Nov 2023: 1.50 Released FY 2022 results; missed Released Q3 2023 results; 30,000 Released Q3 2022 results; 1.30 (‘000 Share Price (US$) reported revenues of €22.3m brokers average revenue reported revenues of shares) Allego’s 10.0 (+105.0%) over prior year guidance by 7.7% and reported €28.6m (+28.2%) over prior 1.10 period revenues of €133.9m (+55.2%) year period 0.90 over prior year period Share price reaction2: 3% Share price reaction2: 0.70 (43.5%) 20,000 Share price reaction2: 5% (11%) 0.50 Jan-24 Mar-24 Jun-24 5.0 Allego started trading on 10,000 17 March 2022 0.0 0 Mar-22 Jun-22 Sep-22 Dec-22 Mar-23 Jun-23 Sep-23 Dec-23 Mar-24 Jun-24 Volume Allego Average daily traded volume (ADTV) ($m) Volume weighted Average Price (VWAP) Allego ($) L1Y Since Free float volumes/ Market Market ADTV listing1 ($) L2Y ($) L1Y ($) L6M ($) L3M ($) (%) NOSH (%) Cap. ($m) Cap. (€m) L1M L3M L6M L12M Allego 4.08 1.00 0.29 0.33 0.54 4.9 18 203 190 Blink 17.95 17.57 16.84 22.34 16.35 91.8 1,261 307 287 VWAP 0.86 1.32 1.29 1.53 ChargePoint 88.13 82.23 48.85 27.45 21.80 91.9 873 774 724 EVgo 15.65 14.11 9.75 7.13 6.16 32.9 263 649 607 Fastned3 0.73 0.68 0.54 0.43 0.39 25.1 24 416s 390 Source: Company filings and FactSet as 14 June 2024 Notes: Share price converted using $/EUR exchange rate of 0.93567 as of 14 June 2024 1 Since Allego’s listing date as of 17 March 2022 2 Close of day share price performance 3 3 Dollarization of share price for comparability converted using $/EUR exchange rate of 0.93567 as of 14 June 2024
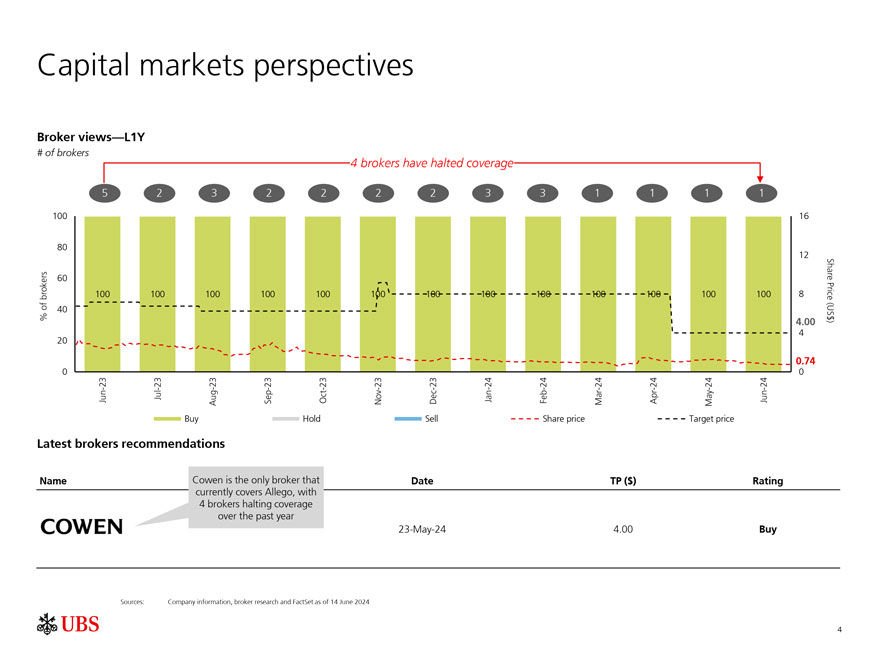
Capital markets perspectives Broker views—L1Y # of brokers 4 brokers have halted coverage 5 2 3 2 2 2 2 3 3 1 1 1 1 100 16 80 12 brokers 60Share 100 100 100 100 100 100 100 100 100 100 100 100 100 8 Price % of 40 (US$) 4.00 20 4 0.74 0 0 Jun-23 Jul-23 Aug-23 Sep-23 Oct-23 Nov-23 Dec-23 Jan-24 Feb-24 Mar-24 Apr-24 May-24 Jun-24 Buy Hold Sell Share price Target price Latest brokers recommendations Name Cowen is the only broker that Date TP ($) Rating currently covers Allego, with 4 brokers halting coverage over the past year 23-May-24 4.00 Buy Sources: Company information, broker research and FactSet as of 14 June 2024 4
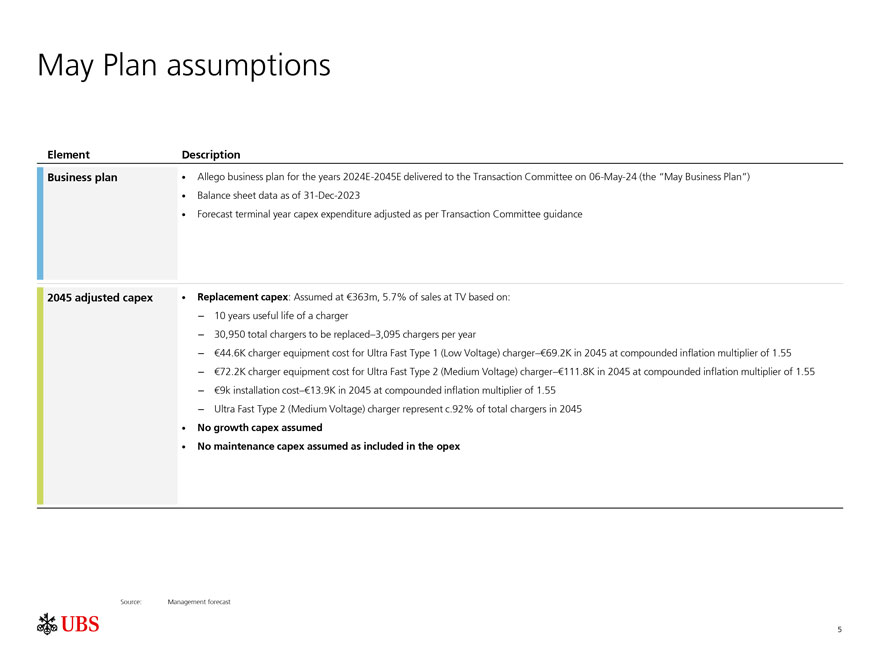
May Plan assumptions Element Description Business plan ï,— Allego business plan for the years 2024E-2045E delivered to the Transaction Committee on 06-May-24 (the “May Business Plan”)ï,— Balance sheet data as of 31-Dec-2023ï,— Forecast terminal year capex expenditure adjusted as per Transaction Committee guidance 2045 adjusted capexï,— Replacement capex: Assumed at €363m, 5.7% of sales at TV based on: – 10 years useful life of a charger – 30,950 total chargers to be replaced–3,095 chargers per year – €44.6K charger equipment cost for Ultra Fast Type 1 (Low Voltage) charger–€69.2K in 2045 at compounded inflation multiplier of 1.55 – €72.2K charger equipment cost for Ultra Fast Type 2 (Medium Voltage) charger–€111.8K in 2045 at compounded inflation multiplier of 1.55 – €9k installation cost–€13.9K in 2045 at compounded inflation multiplier of 1.55 – Ultra Fast Type 2 (Medium Voltage) charger represent c.92% of total chargers in 2045 ï,— No growth capex assumed ï,— No maintenance capex assumed as included in the opex Source: Management forecast 5
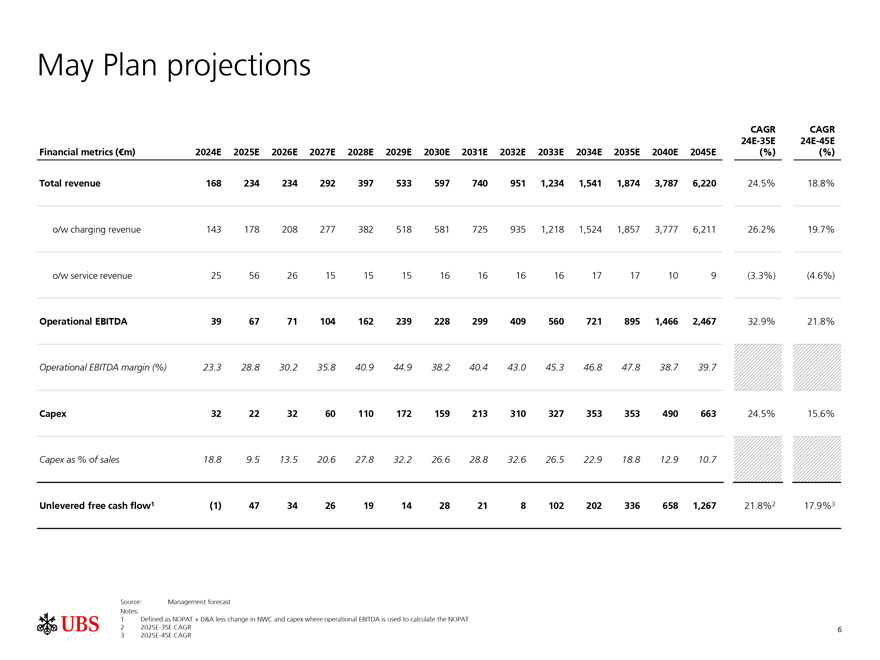
May Plan projections CAGR CAGR 24E-35E 24E-45E Financial metrics (€m) 2024E 2025E 2026E 2027E 2028E 2029E 2030E 2031E 2032E 2033E 2034E 2035E 2040E 2045E (%) (%) Total revenue 168 234 234 292 397 533 597 740 951 1,234 1,541 1,874 3,787 6,220 24.5% 18.8% ok/w charging revenue 143 178 208 277 382 518 581 725 935 1,218 1,524 1,857 3,777 6,211 26.2% 19.7% o/w service revenue 25 56 26 15 15 15 16 16 16 16 17 17 10 9 (3.3%) (4.6%) Operational EBITDA 39 67 71 104 162 239 228 299 409 560 721 895 1,466 2,467 32.9% 21.8% Operational EBITDA margin (%) 23.3 28.8 30.2 35.8 40.9 44.9 38.2 40.4 43.0 45.3 46.8 47.8 38.7 39.7 Capex 32 22 32 60 110 172 159 213 310 327 353 353 490 663 24.5% 15.6% Capex as % of sales 18.8 9.5 13.5 20.6 27.8 32.2 26.6 28.8 32.6 26.5 22.9 18.8 12.9 10.7 Unlevered free cash flow1 (1) 47 34 26 19 14 28 21 8 102 202 336 658 1,267 21.8% 2 17.9% 3 Source: Management forecast Notes: 1 Defined as NOPAT + D&A less change in NWC and capex where operational EBITDA is used to calculate the NOPAT 2 2025E-35E CAGR 6 3 2025E-45E CAGR
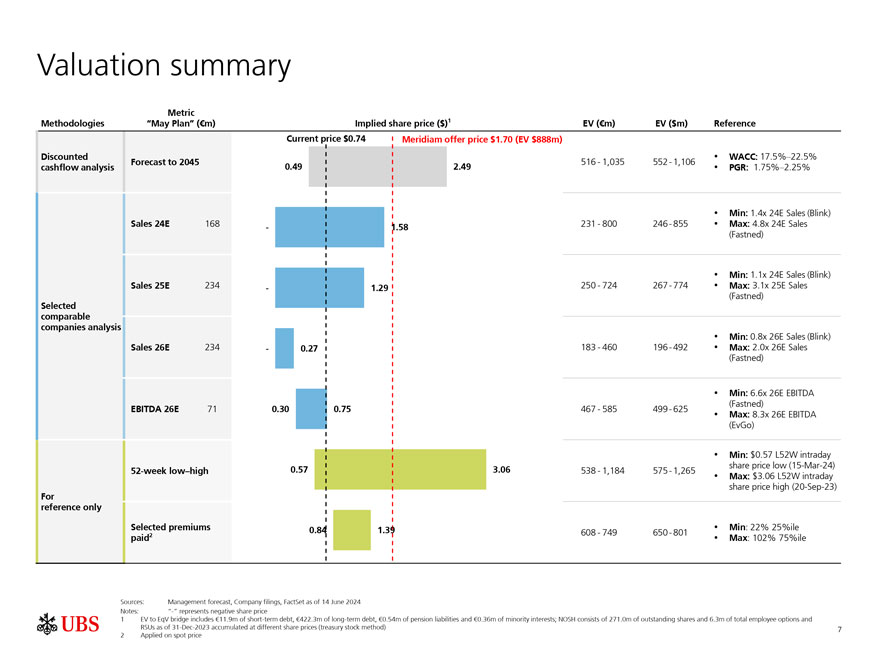
Valuation summary Metric Methodologies “May Plan” (€m) Implied share price ($)1 EV (€m) EV ($m) Reference Current price $0.74 Meridiam offer price $1.70 (EV $888m) Discounted ï,— WACC: 17.5% –22.5% Forecast to 2045 516-1,035 552-1,106 cashflow analysis 0.49 2.49ï,— PGR: 1.75% –2.25% ï,— Min: 1.4x 24E Sales (Blink) Sales 24E 168—1.58 231-800 246-855ï,— Max: 4.8x 24E Sales (Fastned) ï,— Min: 1.1x 24E Sales (Blink) Sales 25E 234—1.29 250-724 267-774ï,— Max: 3.1x 25E Sales (Fastned) Selected comparable companies analysis ï,— Min: 0.8x 26E Sales (Blink) Sales 26E 234—0.27 183-460 196-492ï,— Max: 2.0x 26E Sales (Fastned) ï,— Min: 6.6x 26E EBITDA (Fastned) EBITDA 26E 71 0.30 0.75 467-585 499-625 ï,— Max: 8.3x 26E EBITDA (EvGo) ï,— Min: $0.57 L52W intraday 0.57 3.06 share price low (15-Mar-24) 52-week low–high 538-1,184 575-1,265ï,— Max: $3.06 L52W intraday share price high (20-Sep-23) For reference only Selected premiums 0.84 1.39ï,— Min: 22% 25%ile 2 608-749 650-801 paidï,— Max: 102% 75%ile Sources: Management forecast, Company filings, FactSet as of 14 June 2024 Notes: “-” represents negative share price 1 EV to EqV bridge includes €11.9m of short-term debt, €422.3m of long-term debt, €0.54m of pension liabilities and €0.36m of minority interests; NOSH consists of 271.0m of outstanding shares and 6.3m of total employee options and RSUs as of 31-Dec-2023 accumulated at different share prices (treasury stock method) 7 2 Applied on spot price
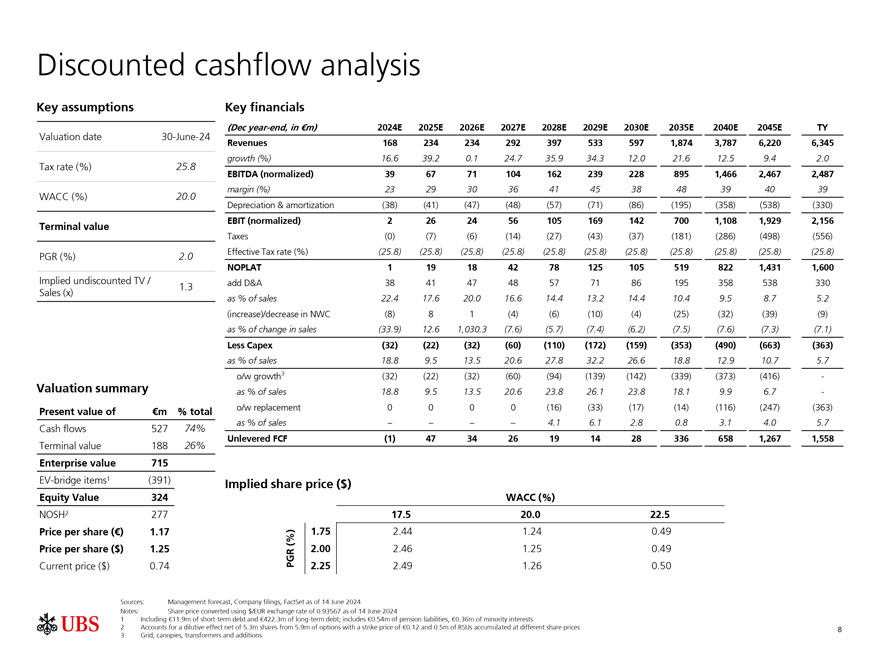
Discounted cashflow analysis Key assumptions Key financials (Dec year-end, in €m) 2024E 2025E 2026E 2027E 2028E 2029E 2030E 2035E 2040E 2045E TY Valuation date 30-June-24 Revenues 168 234 234 292 397 533 597 1,874 3,787 6,220 6,345 Tax rate (%) 25.8 growth (%) 16.6 39.2 0.1 24.7 35.9 34.3 12.0 21.6 12.5 9.4 2.0 EBITDA (normalized) 39 67 71 104 162 239 228 895 1,466 2,467 2,487 margin (%) 23 29 30 36 41 45 38 48 39 40 39 WACC (%) 20.0 Depreciation & amortization (38) (41) (47) (48) (57) (71) (86) (195) (358) (538) (330) EBIT (normalized) 2 26 24 56 105 169 142 700 1,108 1,929 2,156 Terminal value Taxes (0) (7) (6) (14) (27) (43) (37) (181) (286) (498) (556) Effective Tax rate (%) (25.8) (25.8) (25.8) (25.8) (25.8) (25.8) (25.8) (25.8) (25.8) (25.8) (25.8) PGR (%) 2.0 NOPLAT 1 19 18 42 78 125 105 519 822 1,431 1,600 Implied undiscounted TV / add D&A 38 41 47 48 57 71 86 195 358 538 330 1.3 Sales (x) as % of sales 22.4 17.6 20.0 16.6 14.4 13.2 14.4 10.4 9.5 8.7 5.2 (increase)/decrease in NWC (8) 8 1 (4) (6) (10) (4) (25) (32) (39) (9) as % of change in sales (33.9) 12.6 1,030.3 (7.6) (5.7) (7.4) (6.2) (7.5) (7.6) (7.3) (7.1) Less Capex (32) (22) (32) (60) (110) (172) (159) (353) (490) (663) (363) as % of sales 18.8 9.5 13.5 20.6 27.8 32.2 26.6 18.8 12.9 10.7 5.7 o/w growth3 (32) (22) (32) (60) (94) (139) (142) (339) (373) (416)—Valuation summary as % of sales 18.8 9.5 13.5 20.6 23.8 26.1 23.8 18.1 9.9 6.7—Present value of €m % total o/w replacement 0 0 0 0 (16) (33) (17) (14) (116) (247) (363) as % of sales – – – – 4.1 6.1 2.8 0.8 3.1 4.0 5.7 Cash flows 527 74% Unlevered FCF (1) 47 34 26 19 14 28 336 658 1,267 1,558 Terminal value 188 26% Enterprise value 715 EV-bridge items1 (391) Implied share price ($) Equity Value 324 WACC (%) NOSH2 277 17.5 20.0 22.5 Price per share (€) 1.17 1.75 2.44 1.24 0.49 Price per share ($) 1.25 PGR (%) 2.00 2.46 1.25 0.49 Current price ($) 0.74 2.25 2.49 1.26 0.50 Sources: Management forecast, Company filings, FactSet as of 14 June 2024 Notes: Share price converted using $/EUR exchange rate of 0.93567 as of 14 June 2024 1 Including €11.9m of short-term debt and €422.3m of long-term debt; includes €0.54m of pension liabilities, €0.36m of minority interests 2 Accounts for a dilutive effect net of 5.3m shares from 5.9m of options with a strike price of €0.12 and 0.5m of RSUs accumulated at different share prices 8 3 Grid, canopies, transformers and additions
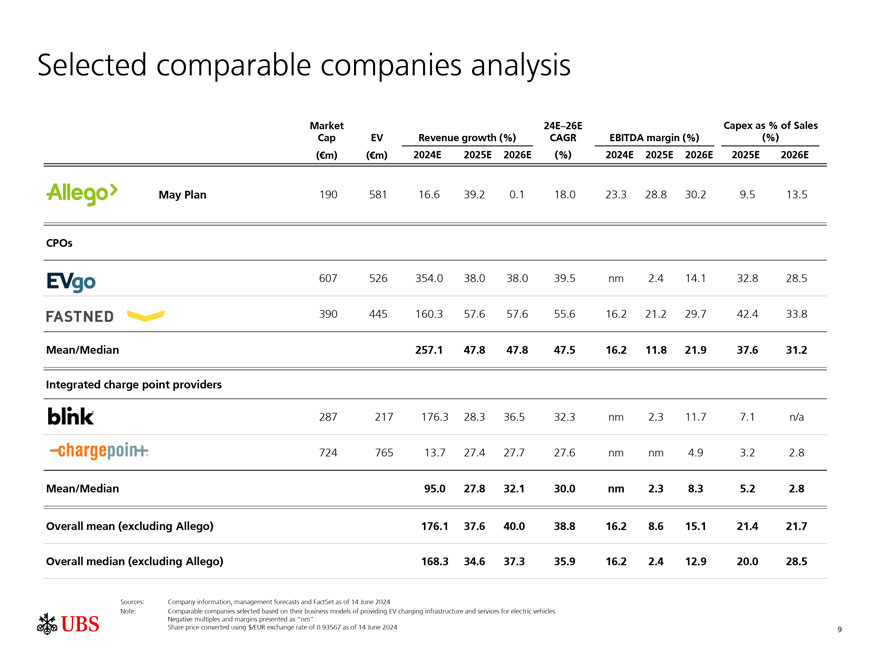
Selected comparable companies analysis Market 24E–26E Capex as % of Sales Cap EV Revenue growth (%) CAGR EBITDA margin (%) (%) (€m) (€m) 2024E 2025E 2026E (%) 2024E 2025E 2026E 2025E 2026E May Plan 190 581 16.6 39.2 0.1 18.0 23.3 28.8 30.2 9.5 13.5 CPOs 607 526 354.0 38.0 38.0 39.5 nm 2.4 14.1 32.8 28.5 390 445 160.3 57.6 57.6 55.6 16.2 21.2 29.7 42.4 33.8 Mean/Median 257.1 47.8 47.8 47.5 16.2 11.8 21.9 37.6 31.2 Integrated charge point providers 287 217 176.3 28.3 36.5 32.3 nm 2.3 11.7 7.1 n/a 724 765 13.7 27.4 27.7 27.6 nm nm 4.9 3.2 2.8 Mean/Median 95.0 27.8 32.1 30.0 nm 2.3 8.3 5.2 2.8 Overall mean (excluding Allego) 176.1 37.6 40.0 38.8 16.2 8.6 15.1 21.4 21.7 Overall median (excluding Allego) 168.3 34.6 37.3 35.9 16.2 2.4 12.9 20.0 28.5 Sources: Company information, management forecasts and FactSet as of 14 June 2024 Note: Comparable companies selected based on their business models of providing EV charging infrastructure and services for electric vehicles Negative multiples and margins presented as “nm” Share price converted using $/EUR exchange rate of 0.93567 as of 14 June 2024 9
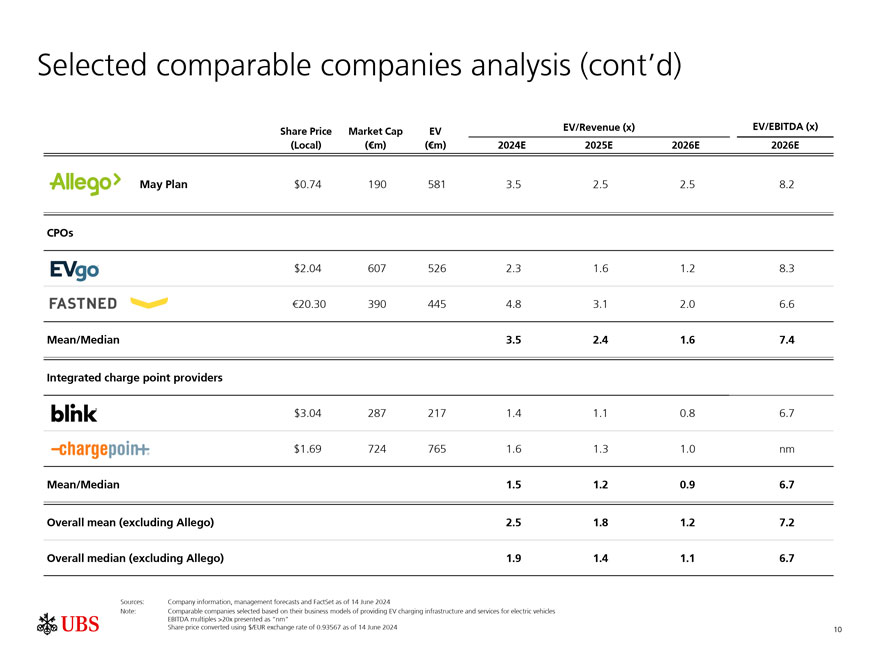
Selected comparable companies analysis (cont’d) EV/Revenue (x) EV/EBITDA (x) Share Price Market Cap EV (Local) (€m) (€m) 2024E 2025E 2026E 2026E May Plan $0.74 190 581 3.5 2.5 2.5 8.2 CPOs $2.04 607 526 2.3 1.6 1.2 8.3 €20.30 390 445 4.8 3.1 2.0 6.6 Mean/Median 3.5 2.4 1.6 7.4 Integrated charge point providers $3.04 287 217 1.4 1.1 0.8 6.7 $1.69 724 765 1.6 1.3 1.0 nm Mean/Median 1.5 1.2 0.9 6.7 Overall mean (excluding Allego) 2.5 1.8 1.2 7.2 Overall median (excluding Allego) 1.9 1.4 1.1 6.7 Sources: Company information, management forecasts and FactSet as of 14 June 2024 Note: Comparable companies selected based on their business models of providing EV charging infrastructure and services for electric vehicles EBITDA multiples >20x presented as “nm” Share price converted using $/EUR exchange rate of 0.93567 as of 14 June 2024 10
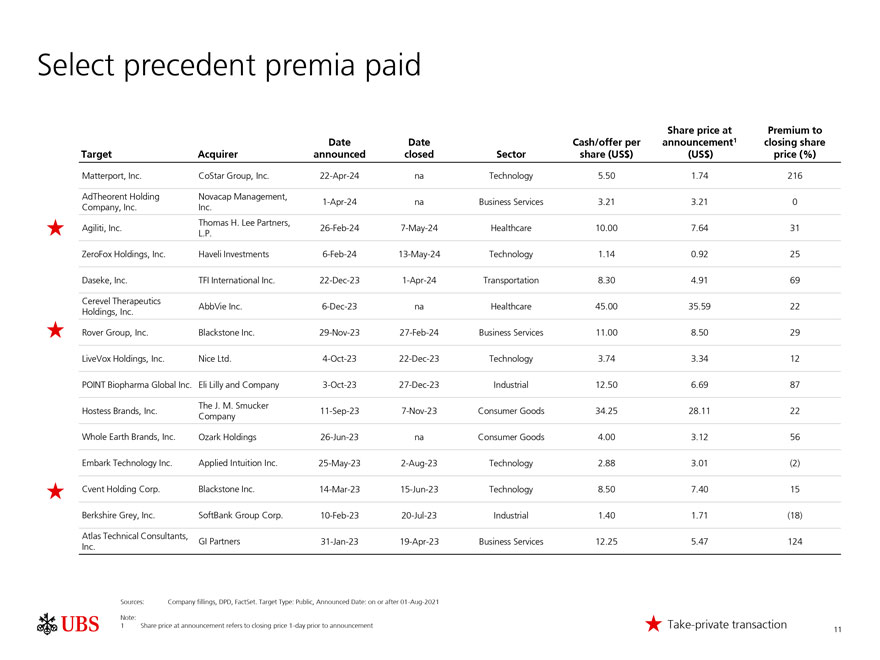
Select precedent premia paid Share price at Premium to Date Date Cash/offer per announcement1 closing share Target Acquirer announced closed Sector share (US$) (US$) price (%) Matterport, Inc. CoStar Group, Inc. 22-Apr-24 na Technology 5.50 1.74 216 AdTheorent Holding Novacap Management, 1-Apr-24 na Business Services 3.21 3.21 0 Company, Inc. Inc. Thomas H. Lee Partners, Agiliti, Inc. 26-Feb-24 7-May-24 Healthcare 10.00 7.64 31 L.P. ZeroFox Holdings, Inc. Haveli Investments 6-Feb-24 13-May-24 Technology 1.14 0.92 25 Daseke, Inc. TFI International Inc. 22-Dec-23 1-Apr-24 Transportation 8.30 4.91 69 Cerevel Therapeutics AbbVie Inc. 6-Dec-23 na Healthcare 45.00 35.59 22 Holdings, Inc. Rover Group, Inc. Blackstone Inc. 29-Nov-23 27-Feb-24 Business Services 11.00 8.50 29 LiveVox Holdings, Inc. Nice Ltd. 4-Oct-23 22-Dec-23 Technology 3.74 3.34 12 POINT Biopharma Global Inc. Eli Lilly and Company 3-Oct-23 27-Dec-23 Industrial 12.50 6.69 87 The J. M. Smucker Hostess Brands, Inc. 11-Sep-23 7-Nov-23 Consumer Goods 34.25 28.11 22 Company Whole Earth Brands, Inc. Ozark Holdings 26-Jun-23 na Consumer Goods 4.00 3.12 56 Embark Technology Inc. Applied Intuition Inc. 25-May-23 2-Aug-23 Technology 2.88 3.01 (2) Cvent Holding Corp. Blackstone Inc. 14-Mar-23 15-Jun-23 Technology 8.50 7.40 15 Berkshire Grey, Inc. SoftBank Group Corp. 10-Feb-23 20-Jul-23 Industrial 1.40 1.71 (18) Atlas Technical Consultants, GI Partners 31-Jan-23 19-Apr-23 Business Services 12.25 5.47 124 Inc. Sources: Company fillings, DPD, FactSet. Target Type: Public, Announced Date: on or after 01-Aug-2021 Note: 1 Share price at announcement refers to closing price 1-day prior to announcement Take-private transaction 11
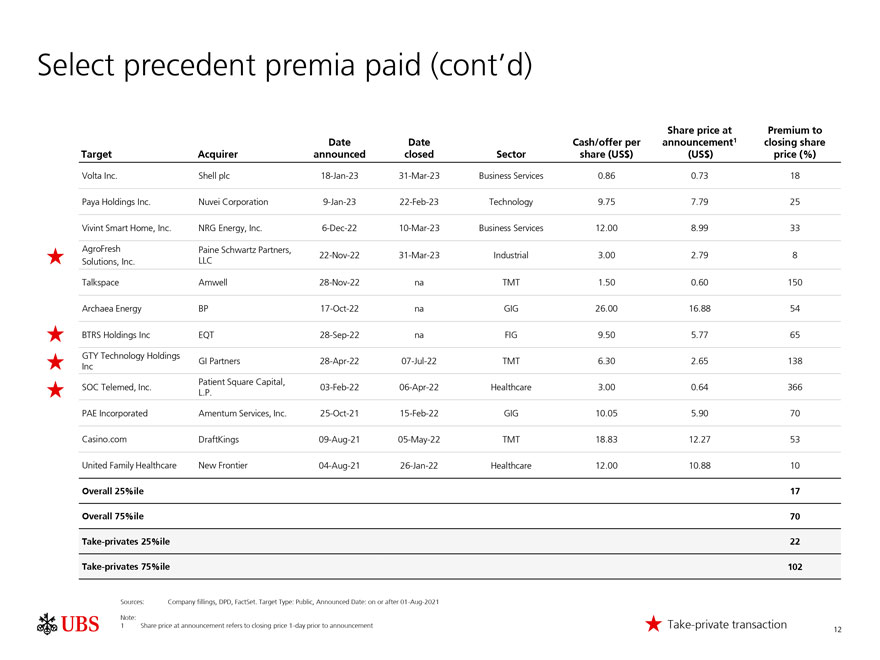
Select precedent premia paid (cont’d) Share price at Premium to Date Date Cash/offer per announcement1 closing share Target Acquirer announced closed Sector share (US$) (US$) price (%) Volta Inc. Shell plc 18-Jan-23 31-Mar-23 Business Services 0.86 0.73 18 Paya Holdings Inc. Nuvei Corporation 9-Jan-23 22-Feb-23 Technology 9.75 7.79 25 Vivint Smart Home, Inc. NRG Energy, Inc. 6-Dec-22 10-Mar-23 Business Services 12.00 8.99 33 AgroFresh Paine Schwartz Partners, 22-Nov-22 31-Mar-23 Industrial 3.00 2.79 8 Solutions, Inc. LLC Talkspace Amwell 28-Nov-22 na TMT 1.50 0.60 150 Archaea Energy BP 17-Oct-22 na GIG 26.00 16.88 54 BTRS Holdings Inc EQT 28-Sep-22 na FIG 9.50 5.77 65 GTY Technology Holdings GI Partners 28-Apr-22 07-Jul-22 TMT 6.30 2.65 138 Inc Patient Square Capital, SOC Telemed, Inc. 03-Feb-22 06-Apr-22 Healthcare 3.00 0.64 366 L.P. PAE Incorporated Amentum Services, Inc. 25-Oct-21 15-Feb-22 GIG 10.05 5.90 70 Casino.com DraftKings 09-Aug-21 05-May-22 TMT 18.83 12.27 53 United Family Healthcare New Frontier 04-Aug-21 26-Jan-22 Healthcare 12.00 10.88 10 Overall 25%ile 17 Overall 75%ile 70 Take-privates 25%ile 22 Take-privates 75%ile 102 Sources: Company fillings, DPD, FactSet. Target Type: Public, Announced Date: on or after 01-Aug-2021 Note: 1 Share price at announcement refers to closing price 1-day prior to announcement Take-private transaction 12

Appendix
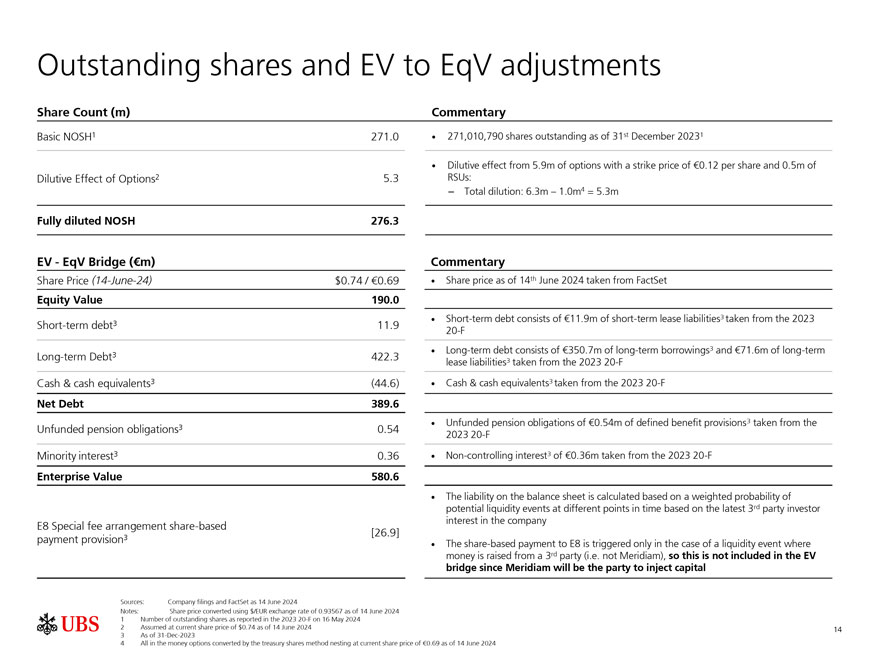
Outstanding shares and EV to EqV adjustments Share Count (m) Commentary Basic NOSH1 271.0ï,— 271,010,790 shares outstanding as of 31st December 20231 ï,— Dilutive effect from 5.9m of options with a strike price of €0.12 per share and 0.5m of Dilutive Effect of Options2 5.3 RSUs: – Total dilution: 6.3m – 1.0m 4 = 5.3m Fully diluted NOSH 276.3 EV—EqV Bridge (€m) Commentary Share Price (14-June-24) $0.74 / €0.69ï,— Share price as of 14th June 2024 taken from FactSet Equity Value 190.0 3ï,— Short-term debt consists of €11.9m of short-term lease liabilities3 taken from the 2023 Short-term debt 11.9 20-F 3ï,— Long-term debt consists of €350.7m of long-term borrowings3 and €71.6m of long-term Long-term Debt 422.3 3 lease liabilities taken from the 2023 20-F Cash & cash equivalents3 (44.6)ï,— Cash & cash equivalents3 taken from the 2023 20-F Net Debt 389.6 3ï,— Unfunded pension obligations of €0.54m of defined benefit provisions3 taken from the Unfunded pension obligations 0.54 2023 20-F Minority interest3 0.36ï,— Non-controlling interest3 of €0.36m taken from the 2023 20-F Enterprise Value 580.6 ï,— The liability on the balance sheet is calculated based on a weighted probability of potential liquidity events at different points in time based on the latest 3rd party investor interest in the company E8 Special fee arrangement share-based [26.9] payment provision3 ï,— The share-based payment to E8 is triggered only in the case of a liquidity event where money is raised from a 3rd party (i.e. not Meridiam), so this is not included in the EV bridge since Meridiam will be the party to inject capital Sources: Company filings and FactSet as 14 June 2024 Notes: Share price converted using $/EUR exchange rate of 0.93567 as of 14 June 2024 1 Number of outstanding shares as reported in the 2023 20-F on 16 May 2024 2 Assumed at current share price of $0.74 as of 14 June 2024 14 3 As of 31-Dec-2023 4 All in the money options converted by the treasury shares method nesting at current share price of €0.69 as of 14 June 2024