Exhibit 99.2 Allego, a leading European public EV fast‐charging network Advancing green electrification Third Quarter 2023 Earnings Presentation November 14, 2023
Disclaimer Forward Looking Statements All statements other than statements of historical facts contained in this presentation are forward‐looking statements. Allego N.V. (“Allego”) intends such forward‐looking statements to be covered by the safe harbor provisions for forward‐looking statements contained in Section 21E of the Securities Exchange Act of 1934 and the Private Securities Litigation Reform Act of 1995. Forward‐looking statements may generally be identified by the use of words such as “believe,” “may,” “will,” “estimate,” “continue,” “anticipate,” “intend,” “expect,” “should,” “would,” “plan,”, “project,” “forecast,” “predict,” “potential,” “seem,” “seek,” “future,” “outlook,” “target” or other similar expressions (or the negative versions of such words or expressions) that predict or indicate future events or trends or that are not statements of historical matters. These forward‐looking statements include, without limitation, Allego’s expectations with respect to future performance. These forward‐looking statements involve significant risks and uncertainties that could cause the actual results to differ materially, and potentially adversely, from those expressed or implied in the forward‐ looking statements. Most of these factors are outside Allego’s control and are difficult to predict. Factors that may cause such differences include, but are not limited to: (i) changes adversely affecting Allego’s business, (ii) the price and availability of electricity and other energy sources, (iii) the risks associated with vulnerability to industry downturns and regional or national downturns, (iv) fluctuations in Allego’s revenue and operating results, (v) unfavorable conditions or further disruptions in the capital and credit markets, (vi) Allego’s ability to generate cash, service indebtedness and incur additional indebtedness, (vii) competition from existing and new competitors, (viii) the growth of the electric vehicle market, (ix) Allego’s ability to integrate any businesses it may acquire, (x) Allego’s ability to recruit and retain experienced personnel, (xi) risks related to legal proceedings or claims, including liability claims, (xii) Allego’s dependence on third‐party contractors to provide various services, (xiii) data security breaches or other network outage; (xiv) Allego’s ability to obtain additional capital on commercially reasonable terms, (xv) Allego’s ability to remediate its material weaknesses in internal control over financial reporting, (xvi) the impact of COVID‐19, including COVID‐19 related supply chain disruptions and expense increases, (xvii) general economic or political conditions, including the Russia/Ukraine conflict or increased trade restrictions between the United States, Russia, China and other countries; and (xviii) other factors detailed under the section entitled “Risk Factors” in Allego’s filings with the Securities and Exchange Commission. The foregoing list of factors is not exclusive. If any of these risks materialize or Allego’s assumptions prove incorrect, actual results could differ materially from the results implied by these forward‐looking statements. There may be additional risks that Allego presently does not know or that Allego currently believes are immaterial that could also cause actual results to differ from those contained in the forward‐ looking statements. In addition, forward‐looking statements reflect Allego’s expectations, plans or forecasts of future events and views as of the date of this presentation. Allego anticipates that subsequent events and developments will cause Allego’s assessments to change. However, while Allego may elect to update these forward‐looking statements at some point in the future, Allego specifically disclaims any obligation to do so, unless required by applicable law. These forward‐looking statements should not be relied upon as representing Allego’s assessments as of any date subsequent to the date of this presentation. Accordingly, undue reliance should not be placed upon the forward‐looking statements. INDUSTRY AND MARKET DATA Although all information and opinions expressed in this presentation, including market data and other statistical information, were obtained from sources believed to be reliable and are included in good faith, Allego has not independently verified the information and makes no representation or warranty, express or implied, as to its accuracy or completeness. Some data is also based on the good faith estimates of Allego, which is derived from its review of internal sources as well as the independent sources described above. This presentation contains preliminary information only, is subject to change at any time and, is not, and should not be assumed to be, complete or to constitute all the information necessary to adequately make an informed decision regarding your investment with Allego. FINANCIAL INFORMATION; NON‐IFRS FINANCIAL MEASURES Some of the financial information and data contained in this presentation, such as EBITDA, Operational EBITDA and free cash flow, have not been prepared in accordance with Dutch generally accepted accounting principles, United States generally accepted accounting principles or the International Financial Reporting Standards (“IFRS”) as issued by the International Accounting Standards Board. We define (i) EBITDA as earnings before interest expense, taxes, depreciation and amortization, (ii) Operational EBITDA as EBITDA further adjusted for reorganization costs, certain business optimization costs, lease buyouts and transaction costs and (iii) free cash flow as net cash flow from operating activities less capital expenditures. Allego believes that the use of these non‐IFRS measures of financial results provide useful information to management and investors regarding certain financial and business trends relating to Allego’s financial condition and results of operations. Allego’s management uses these non‐IFRS measures for trend analyses, for purposes of determining management incentive compensation and for budgeting and planning purposes. Allego believes that the use of these non‐IFRS financial measures provides an additional tool for investors to use in evaluating projected operating results and trends and in comparing Allego’s financial measures with other similar companies, many of which present similar non‐IFRS financial measures to investors. Management does not consider these non‐IFRS measures in isolation or as an alternative to financial measures determined in accordance with IFRS. The principal limitation of these non‐IFRS financial measures is that they exclude significant expenses and income that are required by IFRS to be recorded in Allego’s financial statements. In addition, they are subject to inherent limitations as they reflect the exercise of judgments by management about which expense and income are excluded or included in determining these non‐IFRS financial measures. In order to compensate for these limitations, management presents non‐IFRS financial measures in connection with IFRS results and reconciliations to the most directly comparable IFRS measure are provided in the Appendix to this presentation. TRADEMARKS AND TRADE NAMES Allego owns or has rights to various trademarks, service marks and trade names that it uses in connection with the operation of its businesses. This presentation also contains trademarks, service marks and trade names of third parties, which are the property of their respective owners. The use or display of third parties’ trademarks, service marks, trade names or products in this presentation is not intended to, and does not imply, a relationship with Allego or an endorsement or sponsorship by or of Allego. Solely for convenience, the trademarks, service marks and trade names referred to in this presentation may appear with the ®, TM or SM symbols, but such references are not intended to indicate, in any way, that Allego will not assert, to the fullest extent under applicable law, its rights or the right of the applicable licensor to these trademarks, service marks and trade names. 2
Overview & Key Highlights Mathieu Bonnet, CEO
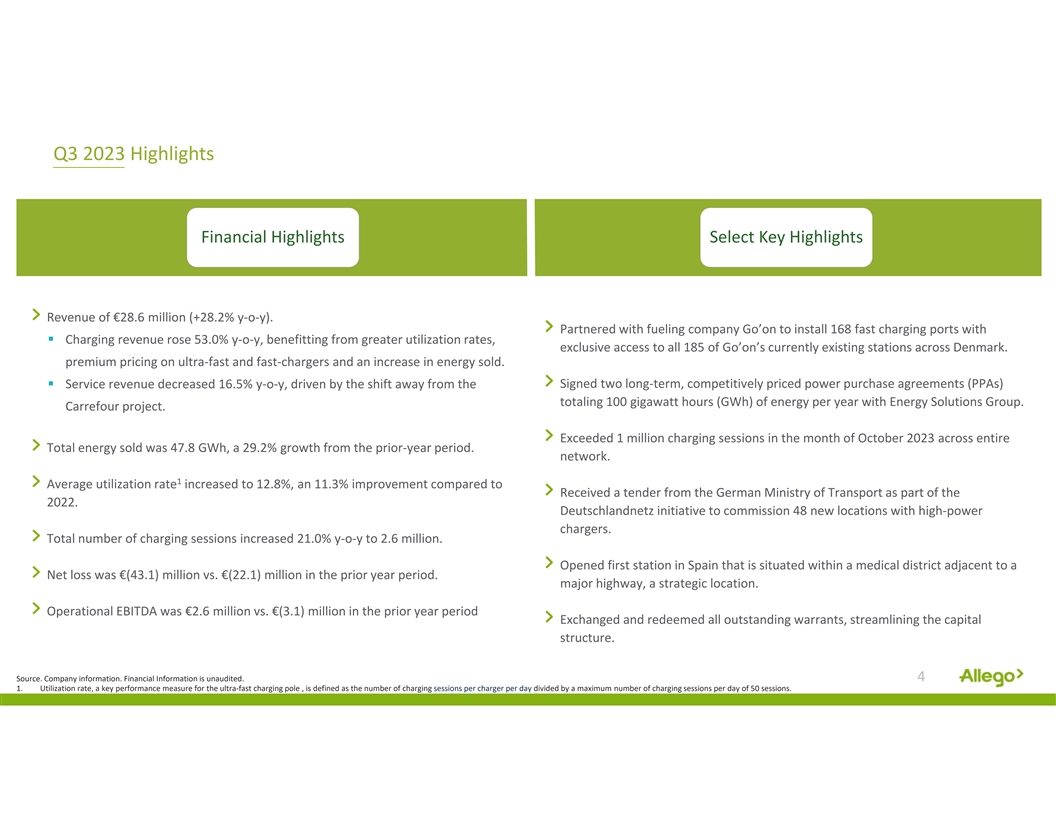
Q3 2023 Highlights Financial Highlights Select Key Highlights Revenue of €28.6 million (+28.2% y‐o‐y). Partnered with fueling company Go’on to install 168 fast charging ports with § Charging revenue rose 53.0% y‐o‐y, benefitting from greater utilization rates, exclusive access to all 185 of Go’on’s currently existing stations across Denmark. premium pricing on ultra‐fast and fast‐chargers and an increase in energy sold. § Service revenue decreased 16.5% y‐o‐y, driven by the shift away from the Signed two long‐term, competitively priced power purchase agreements (PPAs) totaling 100 gigawatt hours (GWh) of energy per year with Energy Solutions Group. Carrefour project. Exceeded 1 million charging sessions in the month of October 2023 across entire Total energy sold was 47.8 GWh, a 29.2% growth from the prior‐year period. network. 1 Average utilization rate increased to 12.8%, an 11.3% improvement compared to Received a tender from the German Ministry of Transport as part of the 2022. Deutschlandnetz initiative to commission 48 new locations with high‐power chargers. Total number of charging sessions increased 21.0% y‐o‐y to 2.6 million. Opened first station in Spain that is situated within a medical district adjacent to a Net loss was €(43.1) million vs. €(22.1) million in the prior year period. major highway, a strategic location. Operational EBITDA was €2.6 million vs. €(3.1) million in the prior year period Exchanged and redeemed all outstanding warrants, streamlining the capital structure. Source. Company information. Financial Information is unaudited. 4 1. Utilization rate, a key performance measure for the ultra‐fast charging pole , is defined as the number of charging sessions per charger per day divided by a maximum number of charging sessions per day of 50 sessions.
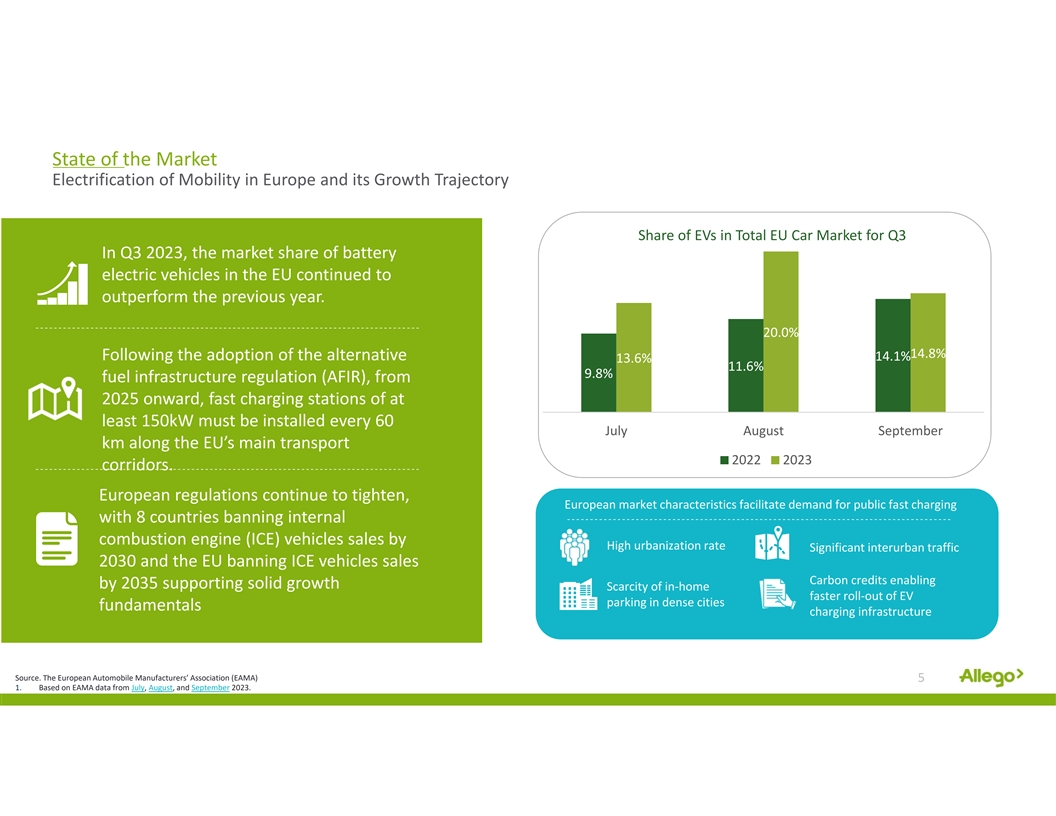
State of the Market Electrification of Mobility in Europe and its Growth Trajectory Share of EVs in Total EU Car Market for Q3 In Q3 2023, the market share of battery electric vehicles in the EU continued to outperform the previous year. 20.0% 14.8% Following the adoption of the alternative 14.1% 13.6% 11.6% 9.8% fuel infrastructure regulation (AFIR), from 2025 onward, fast charging stations of at least 150kW must be installed every 60 July August September km along the EU’s main transport 2022 2023 corridors. European regulations continue to tighten, European market characteristics facilitate demand for public fast charging with 8 countries banning internal combustion engine (ICE) vehicles sales by High urbanization rate Significant interurban traffic 2030 and the EU banning ICE vehicles sales Carbon credits enabling by 2035 supporting solid growth Scarcity of in‐home faster roll‐out of EV parking in dense cities fundamentals charging infrastructure 5 Source. The European Automobile Manufacturers’ Association (EAMA) 5 1. Based on EAMA data from July, August, and September 2023.
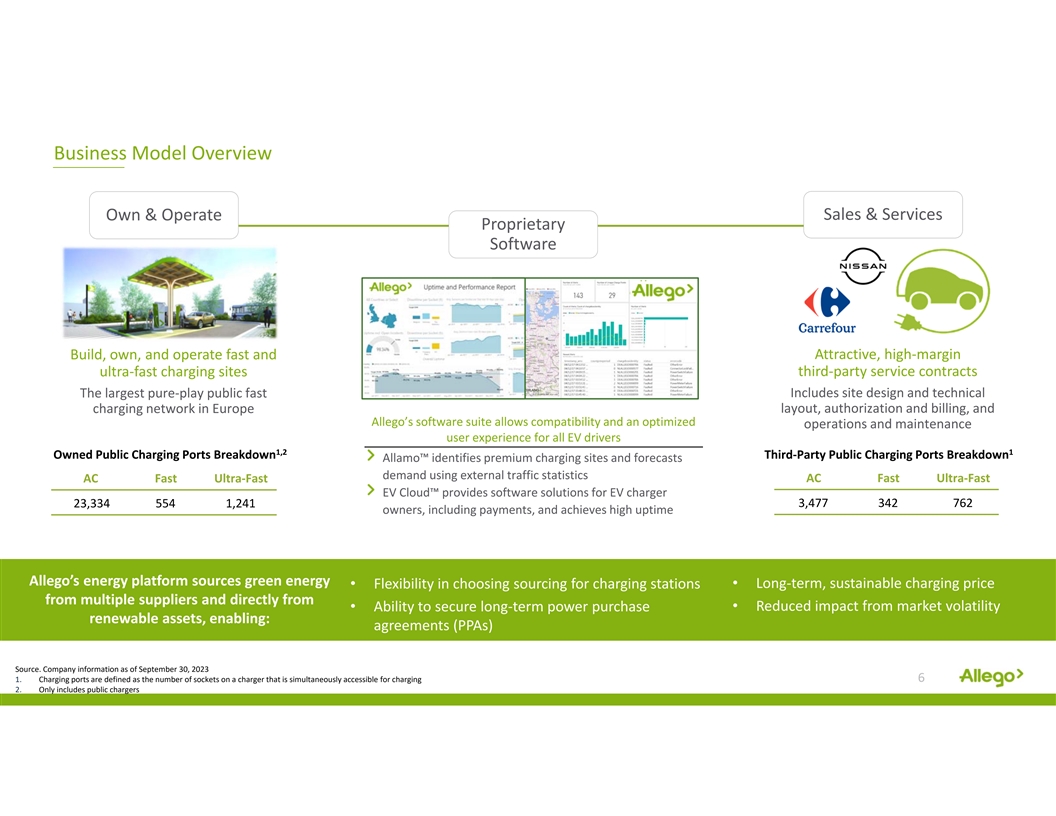
Business Model Overview Sales & Services Own & Operate Proprietary Software Attractive, high‐margin Build, own, and operate fast and ultra‐fast charging sites third‐party service contracts The largest pure‐play public fast Includes site design and technical charging network in Europe layout, authorization and billing, and Allego’s software suite allows compatibility and an optimized operations and maintenance user experience for all EV drivers 1,2 1 Owned Public Charging Ports Breakdown Third‐Party Public Charging Ports Breakdown Allamo™ identifies premium charging sites and forecasts demand using external traffic statistics AC Fast Ultra‐Fast AC Fast Ultra‐Fast EV Cloud™ provides software solutions for EV charger 3,477 342 762 23,334 554 1,241 owners, including payments, and achieves high uptime Allego’s energy platform sources green energy • Long‐term, sustainable charging price • Flexibility in choosing sourcing for charging stations from multiple suppliers and directly from • Reduced impact from market volatility • Ability to secure long‐term power purchase renewable assets, enabling: agreements (PPAs) Source. Company information as of September 30, 2023 1. Charging ports are defined as the number of sockets on a charger that is simultaneously accessible for charging 6 2. Only includes public chargers
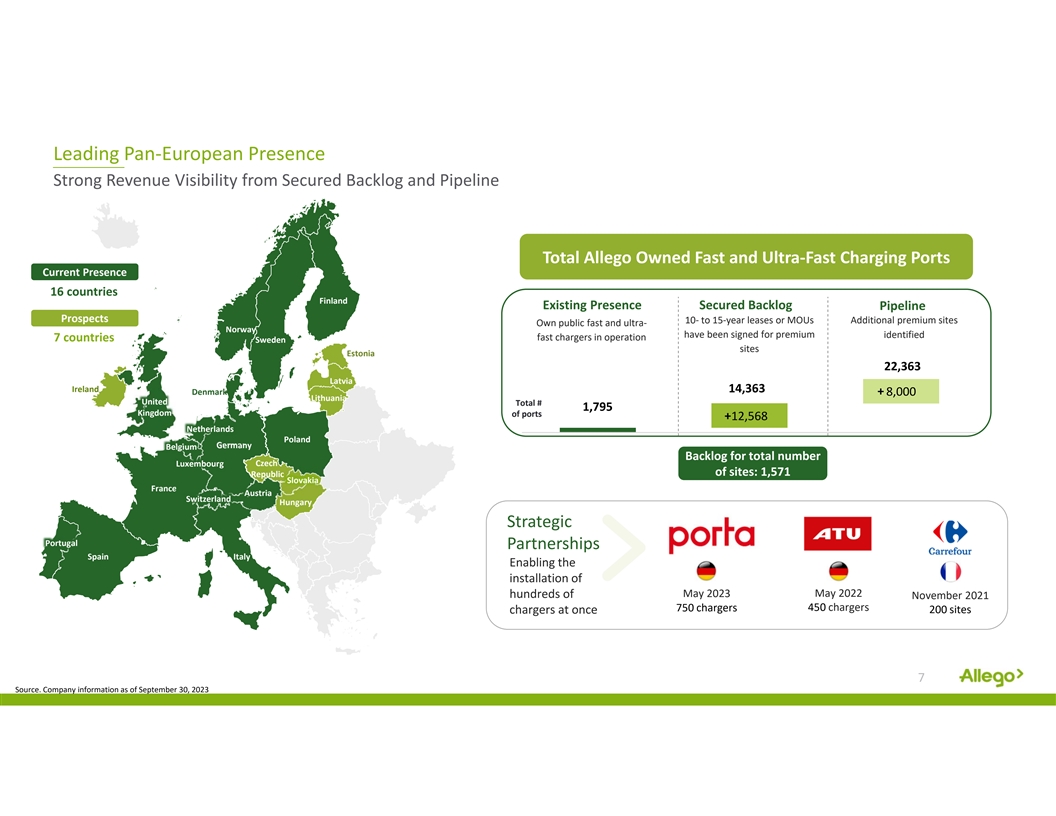
Leading Pan‐European Presence Strong Revenue Visibility from Secured Backlog and Pipeline Total Allego Owned Fast and Ultra‐Fast Charging Ports Current Presence 16 countries Finland Existing Presence Secured Backlog Pipeline Prospects 10‐ to 15‐year leases or MOUs Additional premium sites Own public fast and ultra‐ Norway have been signed for premium identified 7 countries fast chargers in operation Sweden sites Estonia 22,363 Latvia Ireland 14,363 Denmark + 8,000 Lithuania United Total # 1,795 Kingdom of ports +12,568 Netherlands Poland Germany Belgium Backlog for total number Luxembourg Czech of sites: 1,571 Republic Slovakia France Austria Switzerland Hungary Strategic Portugal Partnerships Spain Italy Enabling the installation of May 2023 May 2022 hundreds of November 2021 450 chargers 750 chargers chargers at once 200 sites 7 Source. Company information as of September 30, 2023

Financials Ton Louwers, CFO 8
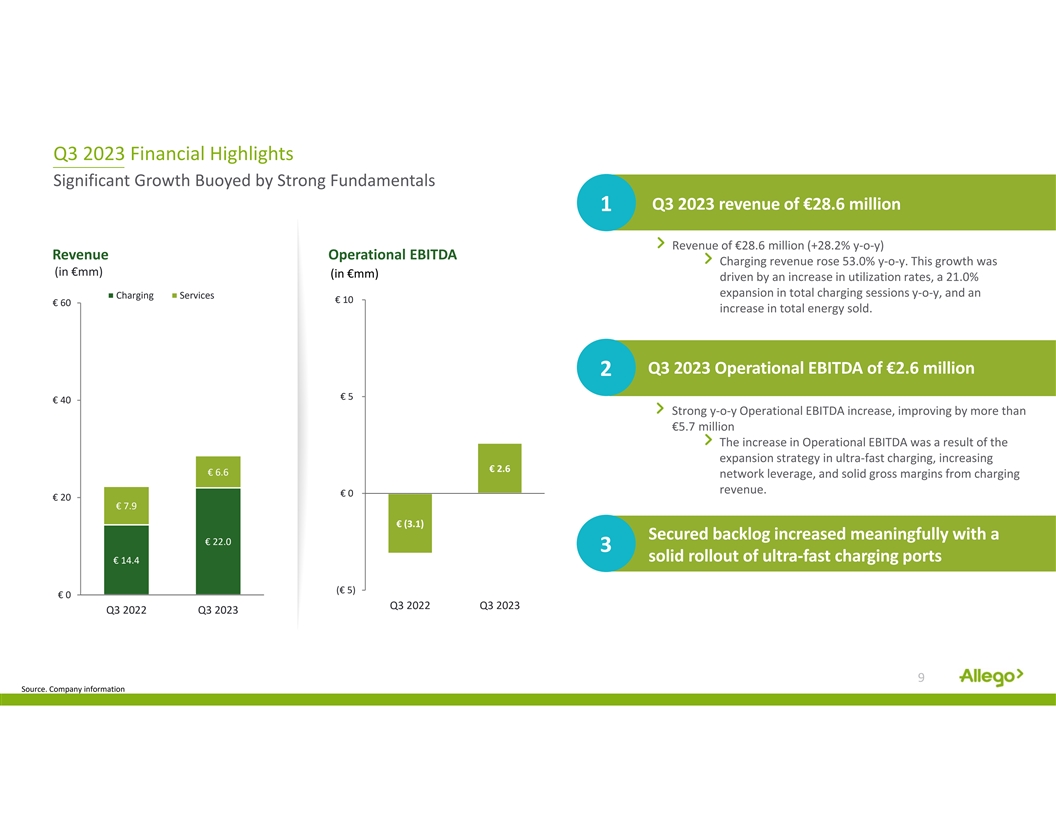
Q3 2023 Financial Highlights Significant Growth Buoyed by Strong Fundamentals Q3 2023 revenue of €28.6 million 1 Revenue of €28.6 million (+28.2% y‐o‐y) Revenue Operational EBITDA Charging revenue rose 53.0% y‐o‐y. This growth was (in €mm) (in €mm) driven by an increase in utilization rates, a 21.0% expansion in total charging sessions y‐o‐y, and an Charging Services € 10 € 60 increase in total energy sold. Q3 2023 Operational EBITDA of €2.6 million 2 € 5 € 40 Strong y‐o‐y Operational EBITDA increase, improving by more than €5.7 million The increase in Operational EBITDA was a result of the expansion strategy in ultra‐fast charging, increasing € 2.6 € 6.6 network leverage, and solid gross margins from charging revenue. € 0 € 20 € 7.9 € (3.1) Secured backlog increased meaningfully with a € 22.0 3 solid rollout of ultra‐fast charging ports € 14.4 (€ 5) € 0 Q3 2022 Q3 2023 Q3 2022 Q3 2023 9 Source. Company information
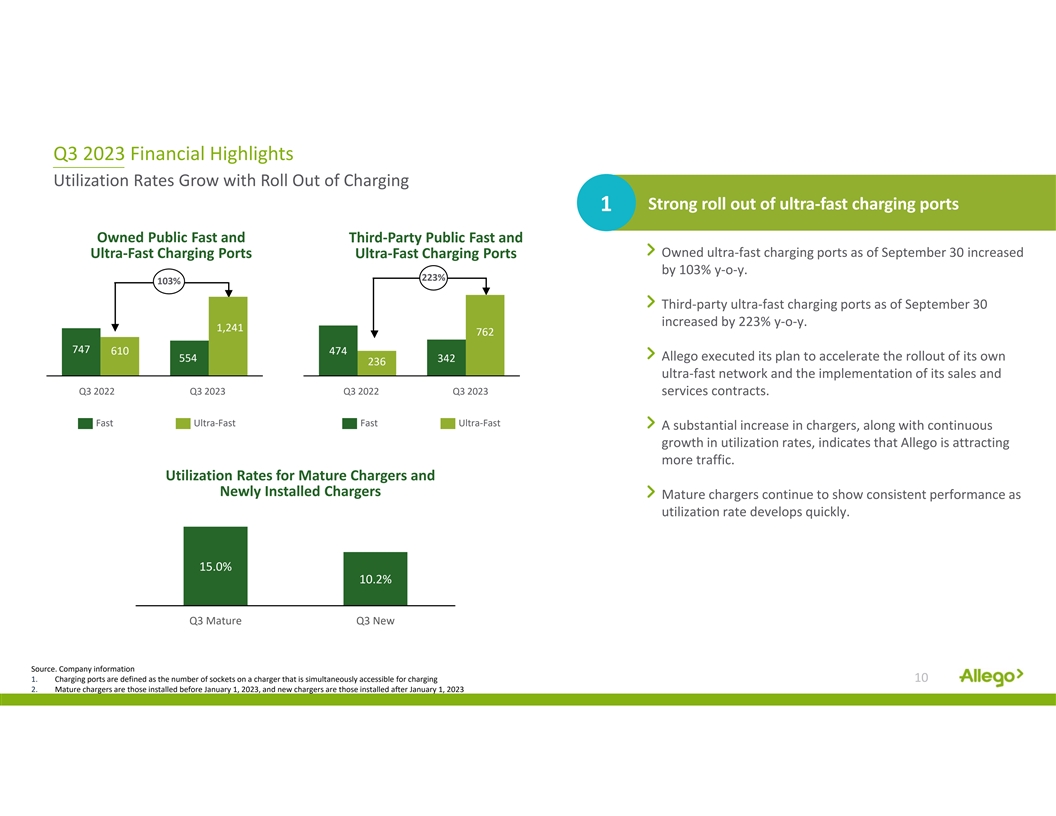
Q3 2023 Financial Highlights Utilization Rates Grow with Roll Out of Charging Strong roll out of ultra‐fast charging ports 1 Owned Public Fast and Third‐Party Public Fast and Owned ultra‐fast charging ports as of September 30 increased Ultra‐Fast Charging Ports Ultra‐Fast Charging Ports by 103% y‐o‐y. 223% 103% Third‐party ultra‐fast charging ports as of September 30 increased by 223% y‐o‐y. 1,241 762 747 610 474 554 Allego executed its plan to accelerate the rollout of its own 342 236 ultra‐fast network and the implementation of its sales and Q3 2022 Q3 2023 Q3 2022 Q3 2023 services contracts. Fast Ultra‐Fast Fast Ultra‐Fast A substantial increase in chargers, along with continuous growth in utilization rates, indicates that Allego is attracting more traffic. Utilization Rates for Mature Chargers and Newly Installed Chargers Mature chargers continue to show consistent performance as utilization rate develops quickly. 15.0% 10.2% Q3 Mature Q3 New Source. Company information 1. Charging ports are defined as the number of sockets on a charger that is simultaneously accessible for charging 10 2. Mature chargers are those installed before January 1, 2023, and new chargers are those installed after January 1, 2023
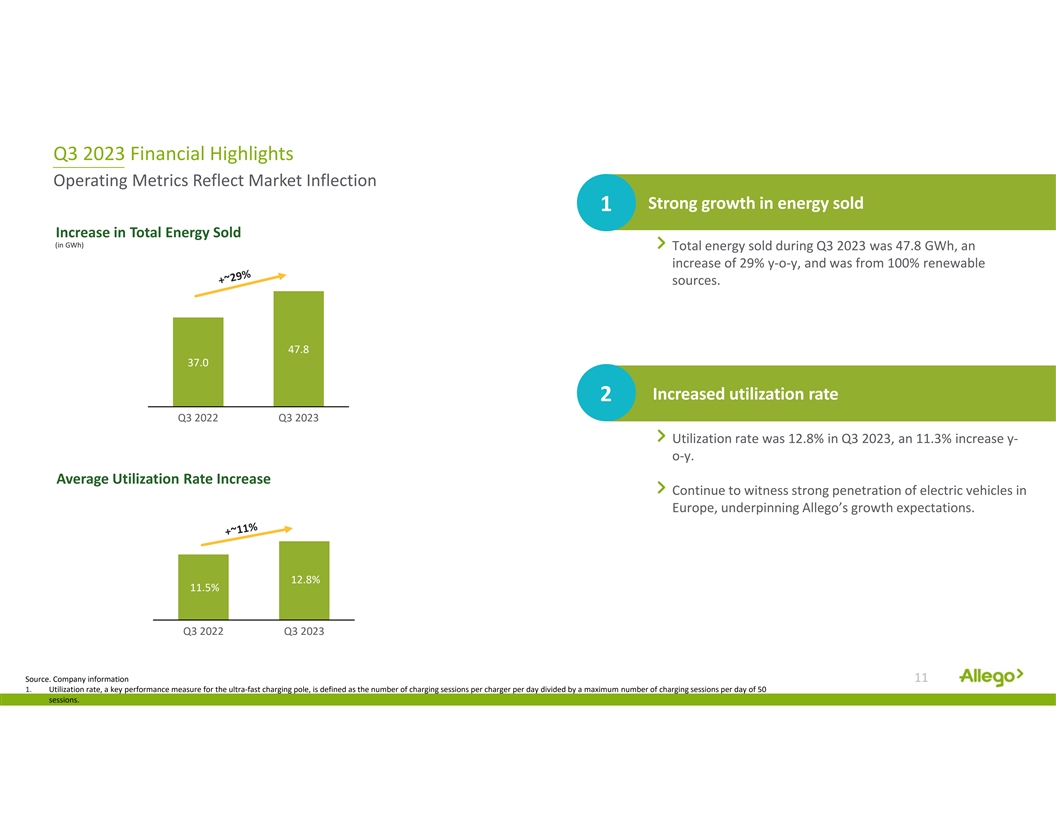
Q3 2023 Financial Highlights Operating Metrics Reflect Market Inflection Strong growth in energy sold 1 Increase in Total Energy Sold (in GWh) Total energy sold during Q3 2023 was 47.8 GWh, an increase of 29% y‐o‐y, and was from 100% renewable sources. 47.8 37.0 Increased utilization rate 2 Q3 2022 Q3 2023 Utilization rate was 12.8% in Q3 2023, an 11.3% increase y‐ o‐y. Average Utilization Rate Increase Continue to witness strong penetration of electric vehicles in Europe, underpinning Allego’s growth expectations. 12.8% 11.5% Q3 2022 Q3 2023 Source. Company information 11 1. Utilization rate, a key performance measure for the ultra‐fast charging pole, is defined as the number of charging sessions per charger per day divided by a maximum number of charging sessions per day of 50 sessions.
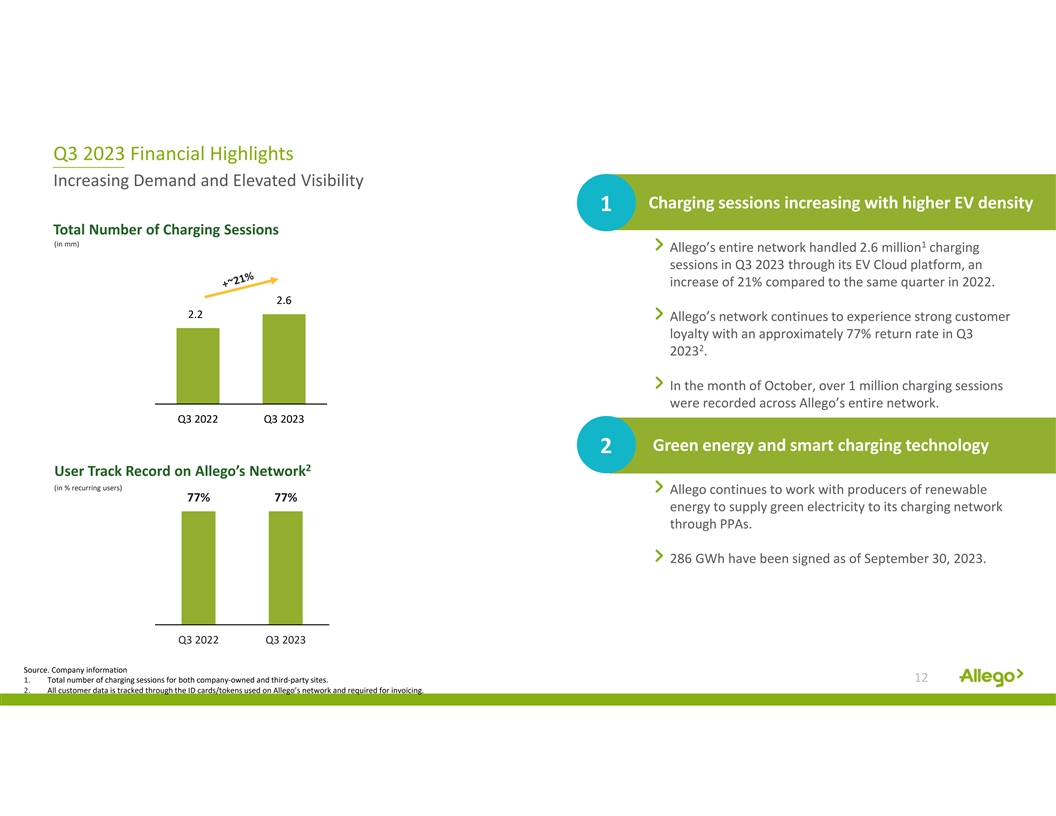
Q3 2023 Financial Highlights Increasing Demand and Elevated Visibility Charging sessions increasing with higher EV density 1 Total Number of Charging Sessions (in mm) 1 Allego’s entire network handled 2.6 million charging sessions in Q3 2023 through its EV Cloud platform, an increase of 21% compared to the same quarter in 2022. 2.6 2.2 Allego’s network continues to experience strong customer loyalty with an approximately 77% return rate in Q3 2 2023 . In the month of October, over 1 million charging sessions were recorded across Allego’s entire network. Q3 2022 Q3 2023 Green energy and smart charging technology 2 2 User Track Record on Allego’s Network (in % recurring users) Allego continues to work with producers of renewable 77% 77% energy to supply green electricity to its charging network through PPAs. 286 GWh have been signed as of September 30, 2023. Q3 2022 Q3 2023 Source. Company information 1. Total number of charging sessions for both company‐owned and third‐party sites. 12 2. All customer data is tracked through the ID cards/tokens used on Allego’s network and required for invoicing.
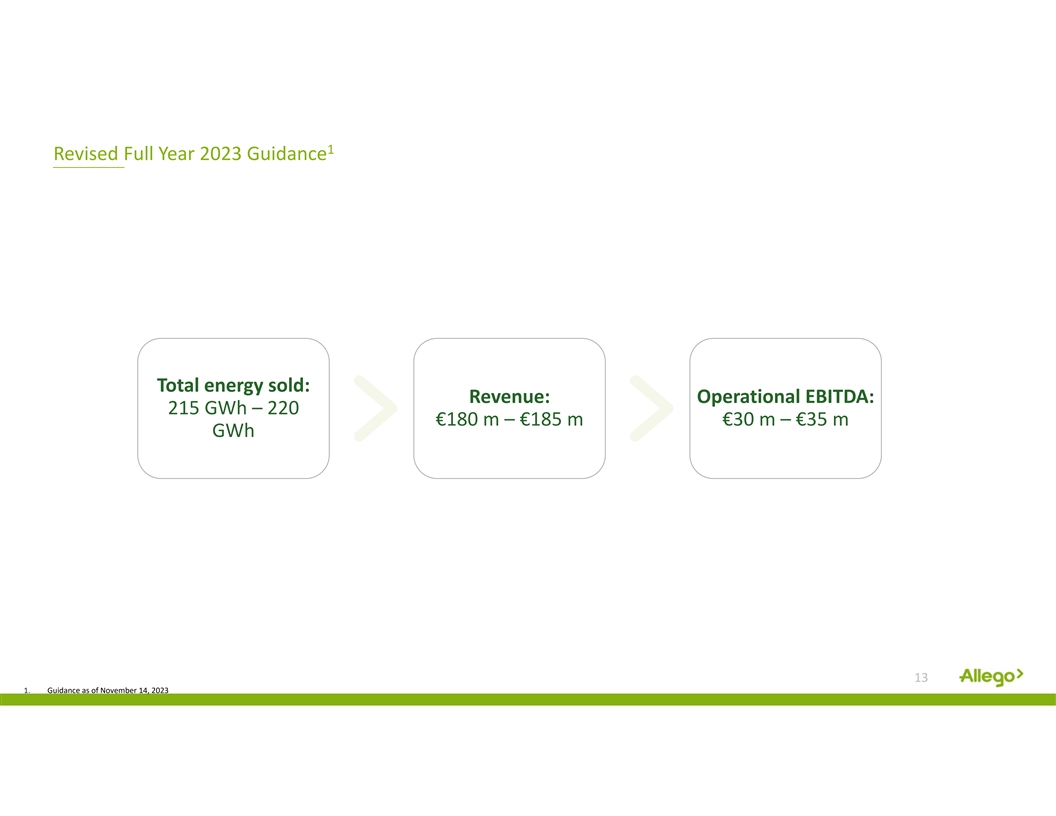
1 Revised Full Year 2023 Guidance Total energy sold: Revenue: Operational EBITDA: 215 GWh – 220 €180 m – €185 m €30 m – €35 m GWh 13 1. Guidance as of November 14, 2023
Appendix Financial Statements Reconciliation
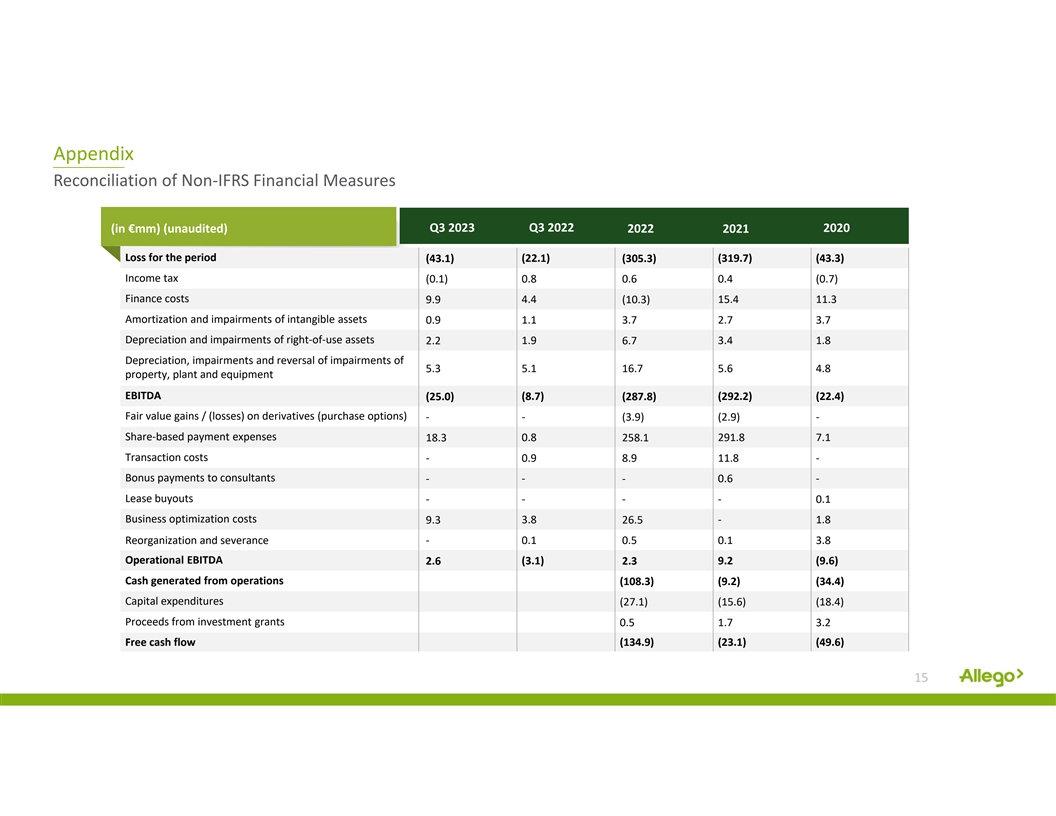
Appendix Reconciliation of Non‐IFRS Financial Measures Q3 2023 Q3 2022 2020 (in €mm) (unaudited) 2022 2021 Loss for the period (43.1) (22.1) (305.3) (319.7) (43.3) Income tax (0.1) 0.8 0.6 0.4 (0.7) Finance costs 4.4 15.4 11.3 9.9 (10.3) Amortization and impairments of intangible assets 0.9 1.1 3.7 2.7 3.7 Depreciation and impairments of right‐of‐use assets 2.2 1.9 6.7 3.4 1.8 Depreciation, impairments and reversal of impairments of 5.3 5.1 16.7 5.6 4.8 property, plant and equipment EBITDA (25.0) (8.7) (287.8) (292.2) (22.4) Fair value gains / (losses) on derivatives (purchase options) ‐ ‐ (3.9) (2.9) ‐ Share‐based payment expenses 18.3 0.8 258.1 291.8 7.1 Transaction costs 0.9 11.8 ‐ ‐ 8.9 Bonus payments to consultants ‐ ‐ ‐ 0.6 ‐ Lease buyouts ‐ ‐ ‐ ‐ 0.1 Business optimization costs 9.3 3.8 26.5 ‐ 1.8 Reorganization and severance ‐ 0.1 0.5 0.1 3.8 Operational EBITDA 2.6 (3.1) 2.3 9.2 (9.6) Cash generated from operations (108.3) (9.2) (34.4) Capital expenditures (27.1) (15.6) (18.4) Proceeds from investment grants 0.5 1.7 3.2 Free cash flow (134.9) (23.1) (49.6) 15