Exhibit 99.2 Allego, a leading European public EV fast‐charging network Advancing green electrification First Half 2023 Earnings Presentation August 15, 2023
Disclaimer Forward Looking Statements All statements other than statements of historical facts contained in this presentation are forward‐looking statements. Allego N.V. (“Allego”) intends such forward‐looking statements to be covered by the safe harbor provisions for forward‐looking statements contained in Section 21E of the Securities Exchange Act of 1934 and the Private Securities Litigation Reform Act of 1995. Forward‐looking statements may generally be identified by the use of words such as “believe,” “may,” “will,” “estimate,” “continue,” “anticipate,” “intend,” “expect,” “should,” “would,” “plan,”, “project,” “forecast,” “predict,” “potential,” “seem,” “seek,” “future,” “outlook,” “target” or other similar expressions (or the negative versions of such words or expressions) that predict or indicate future events or trends or that are not statements of historical matters. These forward‐looking statements include, without limitation, Allego’s expectations with respect to future performance. These forward‐looking statements involve significant risks and uncertainties that could cause the actual results to differ materially, and potentially adversely, from those expressed or implied in the forward‐ looking statements. Most of these factors are outside Allego’s control and are difficult to predict. Factors that may cause such differences include, but are not limited to: (i) changes adversely affecting Allego’s business, (ii) the price and availability of electricity and other energy sources, (iii) the risks associated with vulnerability to industry downturns and regional or national downturns, (iv) fluctuations in Allego’s revenue and operating results, (v) unfavorable conditions or further disruptions in the capital and credit markets, (vi) Allego’s ability to generate cash, service indebtedness and incur additional indebtedness, (vii) competition from existing and new competitors, (viii) the growth of the electric vehicle market, (ix) Allego’s ability to integrate any businesses it may acquire, (x) Allego’s ability to recruit and retain experienced personnel, (xi) risks related to legal proceedings or claims, including liability claims, (xii) Allego’s dependence on third‐party contractors to provide various services, (xiii) data security breaches or other network outage; (xiv) Allego’s ability to obtain additional capital on commercially reasonable terms, (xv) Allego’s ability to remediate its material weaknesses in internal control over financial reporting, (xvi) the impact of COVID‐19, including COVID‐19 related supply chain disruptions and expense increases, (xvii) general economic or political conditions, including the Russia/Ukraine conflict or increased trade restrictions between the United States, Russia, China and other countries; and (xviii) other factors detailed under the section entitled “Risk Factors” in Allego’s filings with the Securities and Exchange Commission. The foregoing list of factors is not exclusive. If any of these risks materialize or Allego’s assumptions prove incorrect, actual results could differ materially from the results implied by these forward‐looking statements. There may be additional risks that Allego presently does not know or that Allego currently believes are immaterial that could also cause actual results to differ from those contained in the forward‐ looking statements. In addition, forward‐looking statements reflect Allego’s expectations, plans or forecasts of future events and views as of the date of this presentation. Allego anticipates that subsequent events and developments will cause Allego’s assessments to change. However, while Allego may elect to update these forward‐looking statements at some point in the future, Allego specifically disclaims any obligation to do so, unless required by applicable law. These forward‐looking statements should not be relied upon as representing Allego’s assessments as of any date subsequent to the date of this presentation. Accordingly, undue reliance should not be placed upon the forward‐looking statements. INDUSTRY AND MARKET DATA Although all information and opinions expressed in this presentation, including market data and other statistical information, were obtained from sources believed to be reliable and are included in good faith, Allego has not independently verified the information and makes no representation or warranty, express or implied, as to its accuracy or completeness. Some data is also based on the good faith estimates of Allego, which is derived from its review of internal sources as well as the independent sources described above. This presentation contains preliminary information only, is subject to change at any time and, is not, and should not be assumed to be, complete or to constitute all the information necessary to adequately make an informed decision regarding your investment with Allego. FINANCIAL INFORMATION; NON‐IFRS FINANCIAL MEASURES Some of the financial information and data contained in this presentation, such as EBITDA, Operational EBITDA and free cash flow, have not been prepared in accordance with Dutch generally accepted accounting principles, United States generally accepted accounting principles or the International Financial Reporting Standards (“IFRS”). We define (i) EBITDA as earnings before interest expense, taxes, depreciation and amortization, (ii) Operational EBITDA as EBITDA further adjusted for reorganization costs, certain business optimization costs, lease buyouts and transaction costs and (iii) free cash flow as net cash flow from operating activities less capital expenditures. Allego believes that the use of these non‐IFRS measures of financial results provide useful information to management and investors regarding certain financial and business trends relating to Allego’s financial condition and results of operations. Allego’s management uses these non‐IFRS measures for trend analyses, for purposes of determining management incentive compensation and for budgeting and planning purposes. Allego believes that the use of these non‐IFRS financial measures provides an additional tool for investors to use in evaluating projected operating results and trends and in comparing Allego’s financial measures with other similar companies, many of which present similar non‐IFRS financial measures to investors. Management does not consider these non‐IFRS measures in isolation or as an alternative to financial measures determined in accordance with IFRS. The principal limitation of these non‐IFRS financial measures is that they exclude significant expenses and income that are required by IFRS to be recorded in Allego’s financial statements. In addition, they are subject to inherent limitations as they reflect the exercise of judgments by management about which expense and income are excluded or included in determining these non‐IFRS financial measures. In order to compensate for these limitations, management presents non‐IFRS financial measures in connection with IFRS results and reconciliations to the most directly comparable IFRS measure are provided in the Appendix to this presentation. TRADEMARKS AND TRADE NAMES Allego owns or has rights to various trademarks, service marks and trade names that it uses in connection with the operation of its businesses. This presentation also contains trademarks, service marks and trade names of third parties, which are the property of their respective owners. The use or display of third parties’ trademarks, service marks, trade names or products in this presentation is not intended to, and does not imply, a relationship with Allego or an endorsement or sponsorship by or of Allego. Solely for convenience, the trademarks, service marks and trade names referred to in this presentation may appear with the ®, TM or SM symbols, but such references are not intended to indicate, in any way, that Allego will not assert, to the fullest extent under applicable law, its rights or the right of the applicable licensor to these trademarks, service marks and trade names. 2
Overview & Key Highlights Mathieu Bonnet, CEO
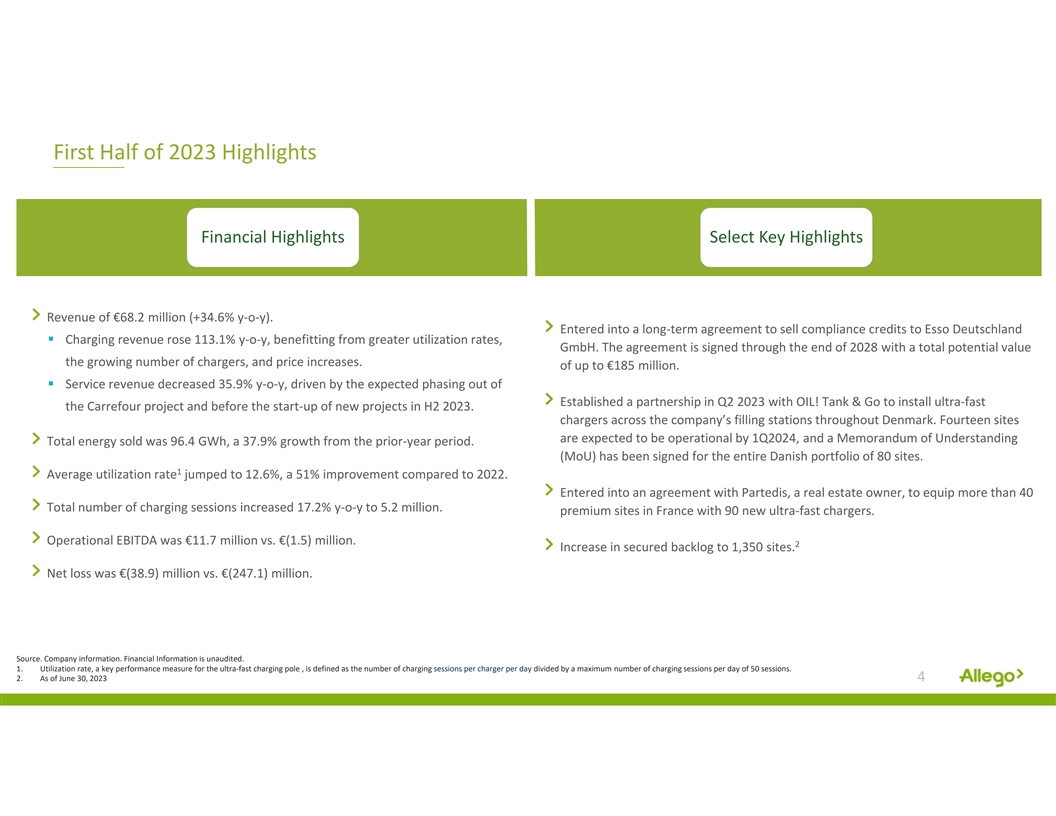
First Half of 2023 Highlights Financial Highlights Select Key Highlights Revenue of €68.2 million (+34.6% y‐o‐y). Entered into a long‐term agreement to sell compliance credits to Esso Deutschland § Charging revenue rose 113.1% y‐o‐y, benefitting from greater utilization rates, GmbH. The agreement is signed through the end of 2028 with a total potential value the growing number of chargers, and price increases. of up to €185 million. § Service revenue decreased 35.9% y‐o‐y, driven by the expected phasing out of Established a partnership in Q2 2023 with OIL! Tank & Go to install ultra‐fast the Carrefour project and before the start‐up of new projects in H2 2023. chargers across the company’s filling stations throughout Denmark. Fourteen sites are expected to be operational by 1Q2024, and a Memorandum of Understanding Total energy sold was 96.4 GWh, a 37.9% growth from the prior‐year period. (MoU) has been signed for the entire Danish portfolio of 80 sites. 1 Average utilization rate jumped to 12.6%, a 51% improvement compared to 2022. Entered into an agreement with Partedis, a real estate owner, to equip more than 40 Total number of charging sessions increased 17.2% y‐o‐y to 5.2 million. premium sites in France with 90 new ultra‐fast chargers. Operational EBITDA was €11.7 million vs. €(1.5) million. 2 Increase in secured backlog to 1,350 sites. Net loss was €(38.9) million vs. €(247.1) million. Source. Company information. Financial Information is unaudited. 1. Utilization rate, a key performance measure for the ultra‐fast charging pole , is defined as the number of charging sessions per charger per day divided by a maximum number of charging sessions per day of 50 sessions. 2. As of June 30, 2023 4
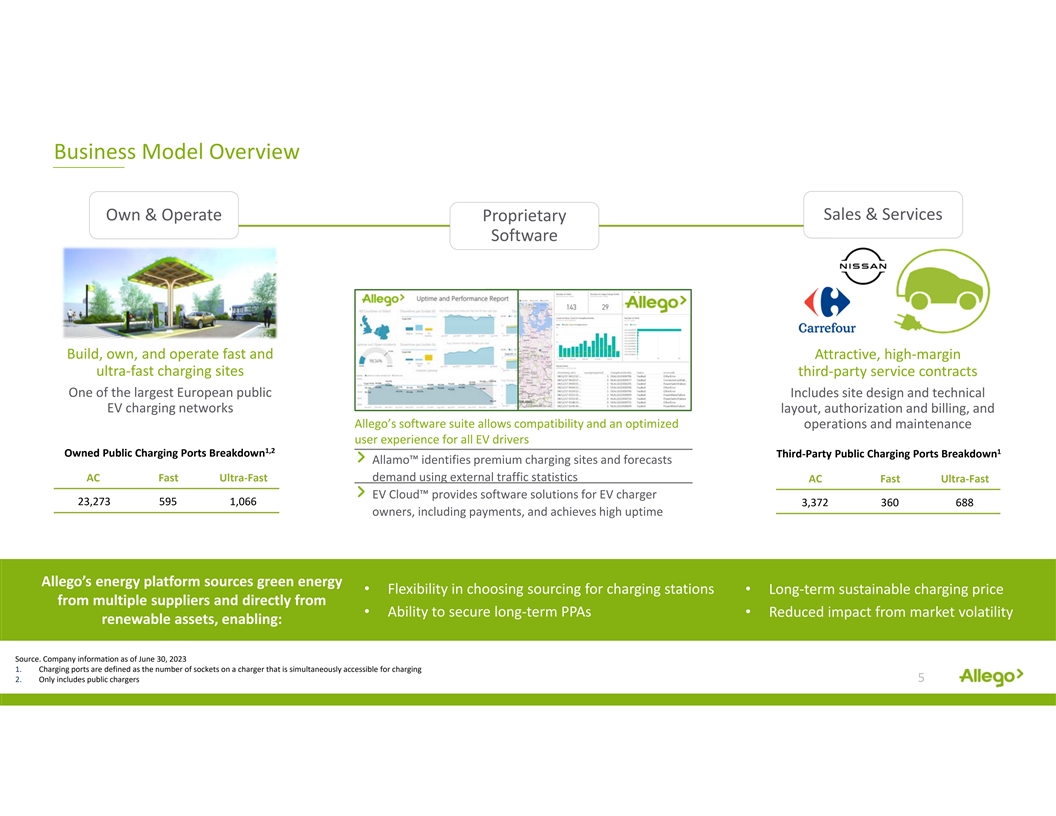
Business Model Overview Sales & Services Own & Operate Proprietary Software Build, own, and operate fast and Attractive, high‐margin ultra‐fast charging sites third‐party service contracts One of the largest European public Includes site design and technical EV charging networks layout, authorization and billing, and Allego’s software suite allows compatibility and an optimized operations and maintenance user experience for all EV drivers 1,2 1 Owned Public Charging Ports Breakdown Third‐Party Public Charging Ports Breakdown Allamo™ identifies premium charging sites and forecasts AC Fast Ultra‐Fast demand using external traffic statistics AC Fast Ultra‐Fast EV Cloud™ provides software solutions for EV charger 23,273 595 1,066 3,372 360 688 owners, including payments, and achieves high uptime Allego’s energy platform sources green energy • Flexibility in choosing sourcing for charging stations• Long‐term sustainable charging price from multiple suppliers and directly from • Ability to secure long‐term PPAs• Reduced impact from market volatility renewable assets, enabling: Source. Company information as of June 30, 2023 1. Charging ports are defined as the number of sockets on a charger that is simultaneously accessible for charging 2. Only includes public chargers 5
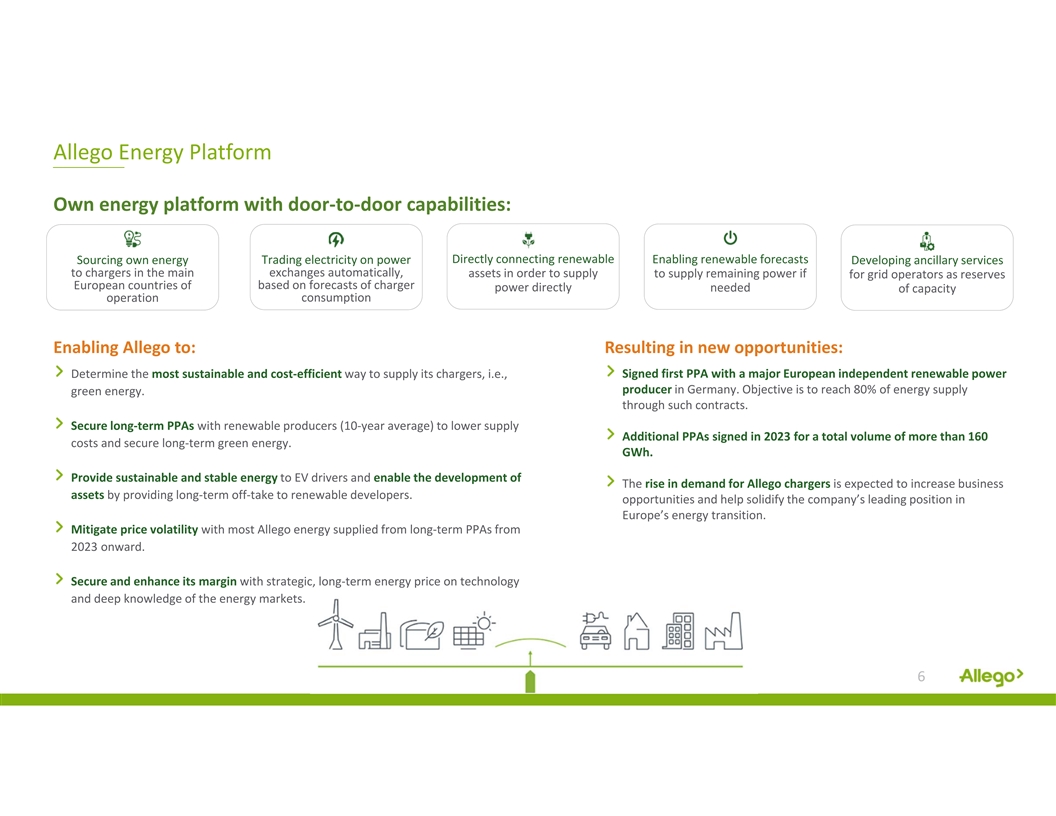
Allego Energy Platform Own energy platform with door‐to‐door capabilities: Directly connecting renewable Sourcing own energy Trading electricity on power Enabling renewable forecasts Developing ancillary services to chargers in the main exchanges automatically, assets in order to supply to supply remaining power if for grid operators as reserves European countries of based on forecasts of charger power directly needed of capacity consumption operation Enabling Allego to: Resulting in new opportunities: Signed first PPA with a major European independent renewable power Determine the most sustainable and cost‐efficient way to supply its chargers, i.e., producer in Germany. Objective is to reach 80% of energy supply green energy. through such contracts. Secure long‐term PPAs with renewable producers (10‐year average) to lower supply Additional PPAs signed in 2023 for a total volume of more than 160 costs and secure long‐term green energy. GWh. Provide sustainable and stable energy to EV drivers and enable the development of The rise in demand for Allego chargers is expected to increase business assets by providing long‐term off‐take to renewable developers. opportunities and help solidify the company’s leading position in Europe’s energy transition. Mitigate price volatility with most Allego energy supplied from long‐term PPAs from 2023 onward. Secure and enhance its margin with strategic, long‐term energy price on technology and deep knowledge of the energy markets. 6

First Half of 2023 Highlights Strong Revenue Visibility from Secured Backlog and Pipeline Total Allego Owned Fast and Ultra‐Fast Charging Ports Existing Presence Secured Backlog Pipeline 1,000 Additional Sites ~1,000 Sites ~1,350 Sites 20,461 First half First half 8,000 12,461 backlog backlog increased increased 10,800 22.7% 22.7% y‐o‐y y‐o‐y # of 1,661 ports 10‐ 15 to 20‐year leases or Public fast charging ports Additional premium Operational MOUs have been signed for in operation sites identified premium sites Secured expansion Utilization trend validated Exclusivity secured Exclusivity in discussion Future expansion plans Source: Company Information, Data as of June 30, 2022 7

Financials Ton Louwers, CFO 8
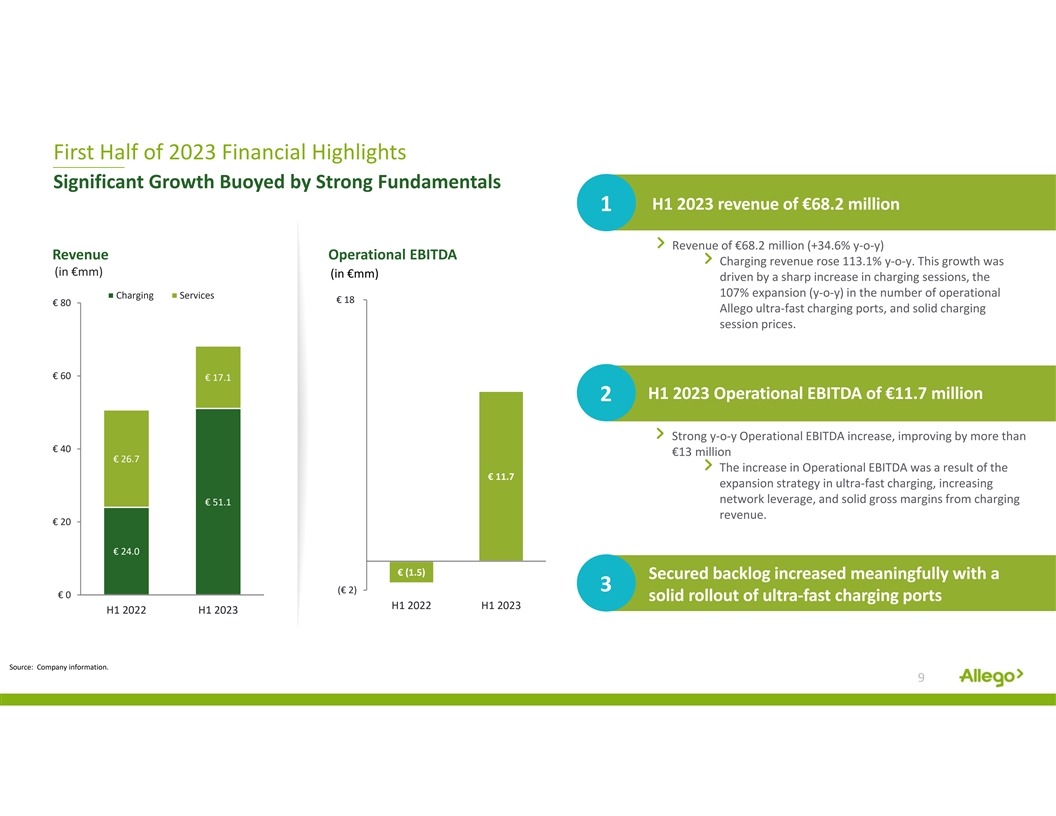
First Half of 2023 Financial Highlights Significant Growth Buoyed by Strong Fundamentals H1 2023 revenue of €68.2 million 1 Revenue of €68.2 million (+34.6% y‐o‐y) Revenue Operational EBITDA Charging revenue rose 113.1% y‐o‐y. This growth was (in €mm) (in €mm) driven by a sharp increase in charging sessions, the 107% expansion (y‐o‐y) in the number of operational Charging Services € 18 € 80 Allego ultra‐fast charging ports, and solid charging session prices. € 60 € 17.1 H1 2023 Operational EBITDA of €11.7 million 2 Strong y‐o‐y Operational EBITDA increase, improving by more than € 40 €13 million € 26.7 The increase in Operational EBITDA was a result of the € 11.7 expansion strategy in ultra‐fast charging, increasing network leverage, and solid gross margins from charging € 51.1 revenue. € 20 € 24.0 € (1.5) Secured backlog increased meaningfully with a 3 (€ 2) € 0 solid rollout of ultra‐fast charging ports H1 2022 H1 2023 H1 2022 H1 2023 Source: Company information. 9
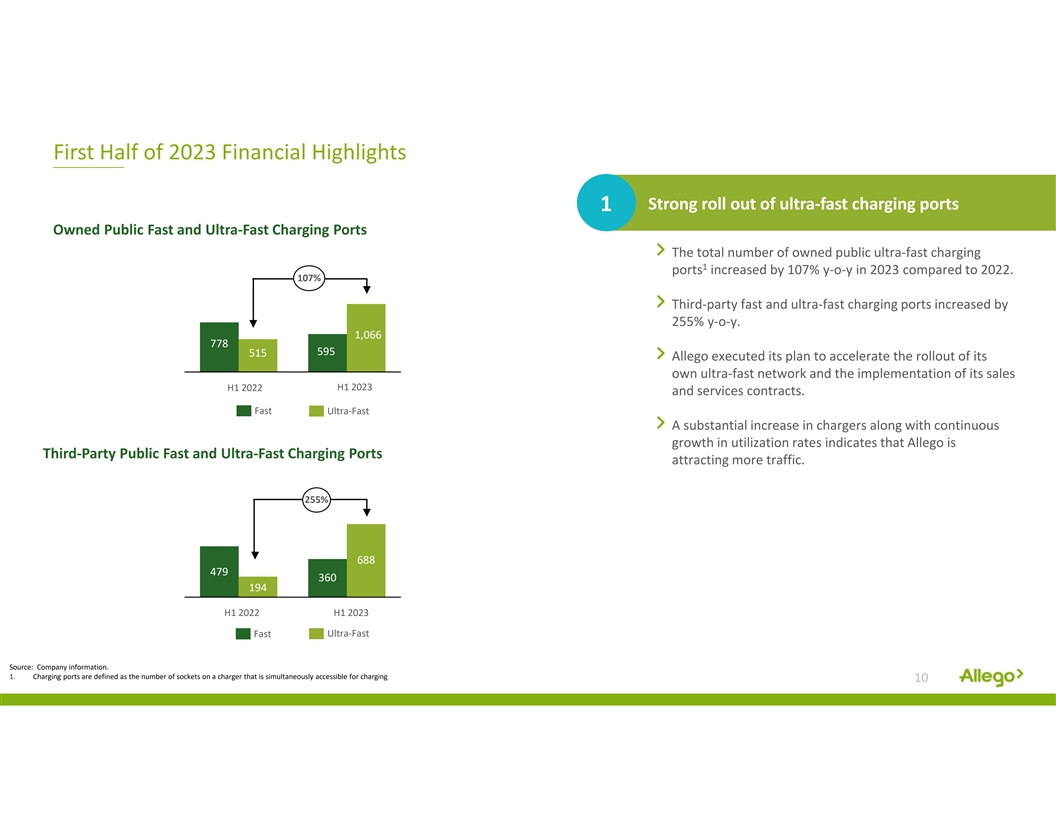
First Half of 2023 Financial Highlights Strong roll out of ultra‐fast charging ports 1 Owned Public Fast and Ultra‐Fast Charging Ports The total number of owned public ultra‐fast charging 1 ports increased by 107% y‐o‐y in 2023 compared to 2022. 107% Third‐party fast and ultra‐fast charging ports increased by 255% y‐o‐y. 1,066 778 595 515 Allego executed its plan to accelerate the rollout of its own ultra‐fast network and the implementation of its sales H1 2023 H1 2022 and services contracts. Fast Ultra‐Fast A substantial increase in chargers along with continuous growth in utilization rates indicates that Allego is Third‐Party Public Fast and Ultra‐Fast Charging Ports attracting more traffic. 255% 688 479 360 194 H1 2022 H1 2023 Fast Ultra‐Fast Source: Company information. 1. Charging ports are defined as the number of sockets on a charger that is simultaneously accessible for charging 10
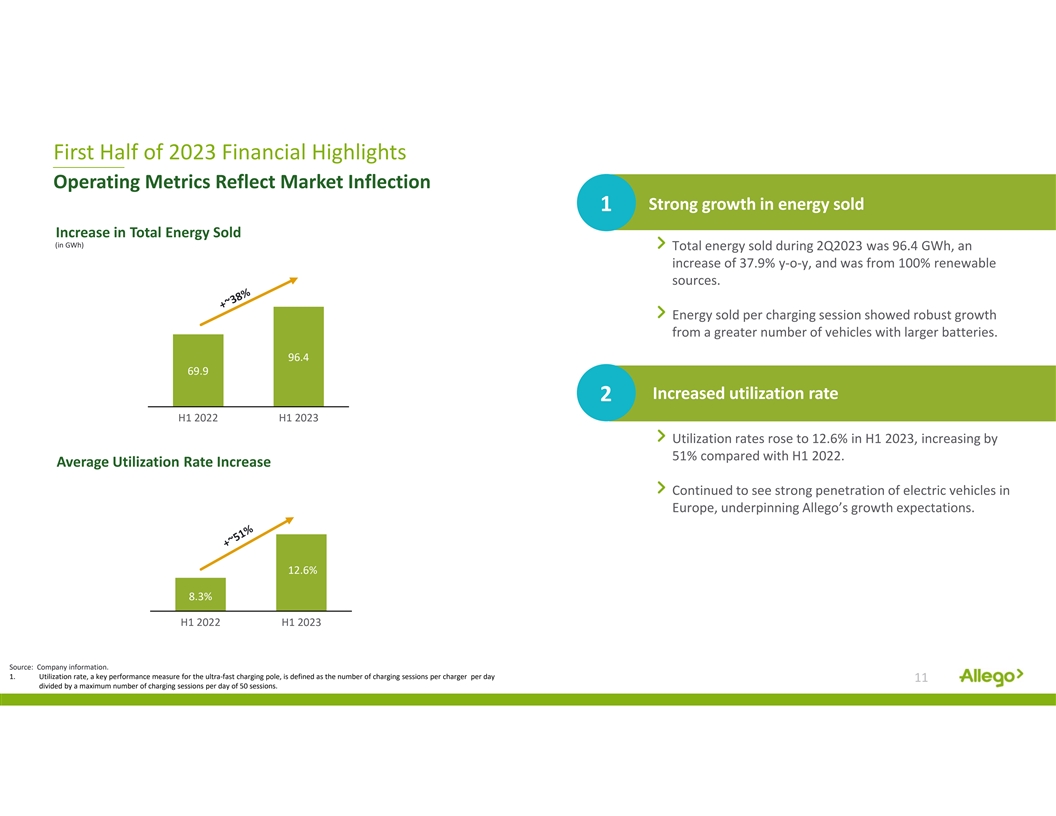
First Half of 2023 Financial Highlights Operating Metrics Reflect Market Inflection Strong growth in energy sold 1 Increase in Total Energy Sold (in GWh) Total energy sold during 2Q2023 was 96.4 GWh, an increase of 37.9% y‐o‐y, and was from 100% renewable sources. Energy sold per charging session showed robust growth from a greater number of vehicles with larger batteries. 96.4 69.9 Increased utilization rate 2 H1 2022 H1 2023 Utilization rates rose to 12.6% in H1 2023, increasing by 51% compared with H1 2022. Average Utilization Rate Increase Continued to see strong penetration of electric vehicles in Europe, underpinning Allego’s growth expectations. 12.6% 8.3% H1 2022 H1 2023 Source: Company information. 1. Utilization rate, a key performance measure for the ultra‐fast charging pole, is defined as the number of charging sessions per charger per day 11 divided by a maximum number of charging sessions per day of 50 sessions.

First Half of 2023 Financial Highlights Increasing Demand and Elevated Visibility Charging sessions increasing with higher EV density 1 Total Number of Charging Sessions (in mm) 1 Allego’s network handled 5.2 million charging sessions in 2023 through its EV Cloud platform, an increase of 17.2% compared to the same period in 2022. 5.2 4.4 Allego’s network continues to experience strong customer loyalty with an approximately 80% return rate in H1 2 2023 . Green energy and smart charging technology 2 H1 2022 H1 2023 Allego continues to work with producers of renewable energy to supply green electricity to its charging network User Track Record on Allego’s Network through PPAs. (in % recurring users) 160 GWh have been signed as of H1 2023. 80% 80% Development of technology for load balancing implemented in Q2 2023, which will open future ancillary services. H1 2022 H1 2023 Source: Company information. 1. Total number of charging sessions for both company‐owned and third‐party sites 12 2. All customer data is tracked through the ID cards/tokens used on Allego’s network and required for invoicing
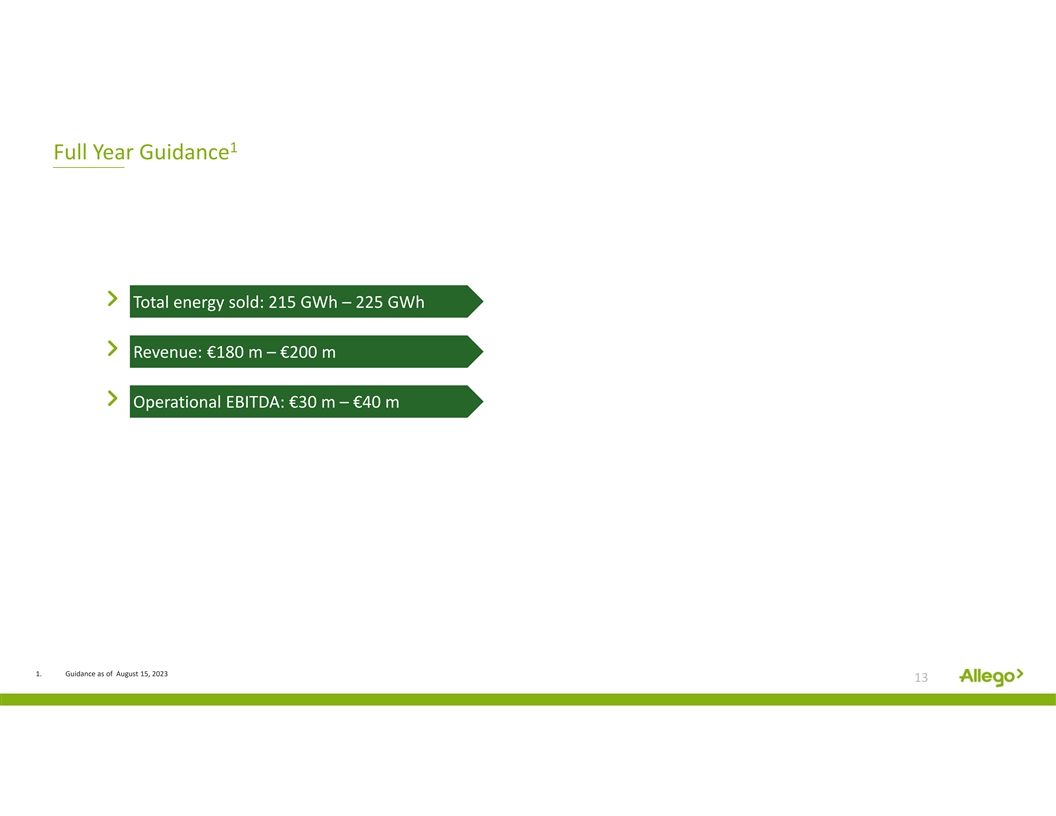
1 Full Year Guidance Total energy sold: 215 GWh – 225 GWh Revenue: €180 m – €200 m Operational EBITDA: €30 m – €40 m 1. Guidance as of August 15, 2023 13
Appendix Financial Statements Reconciliation
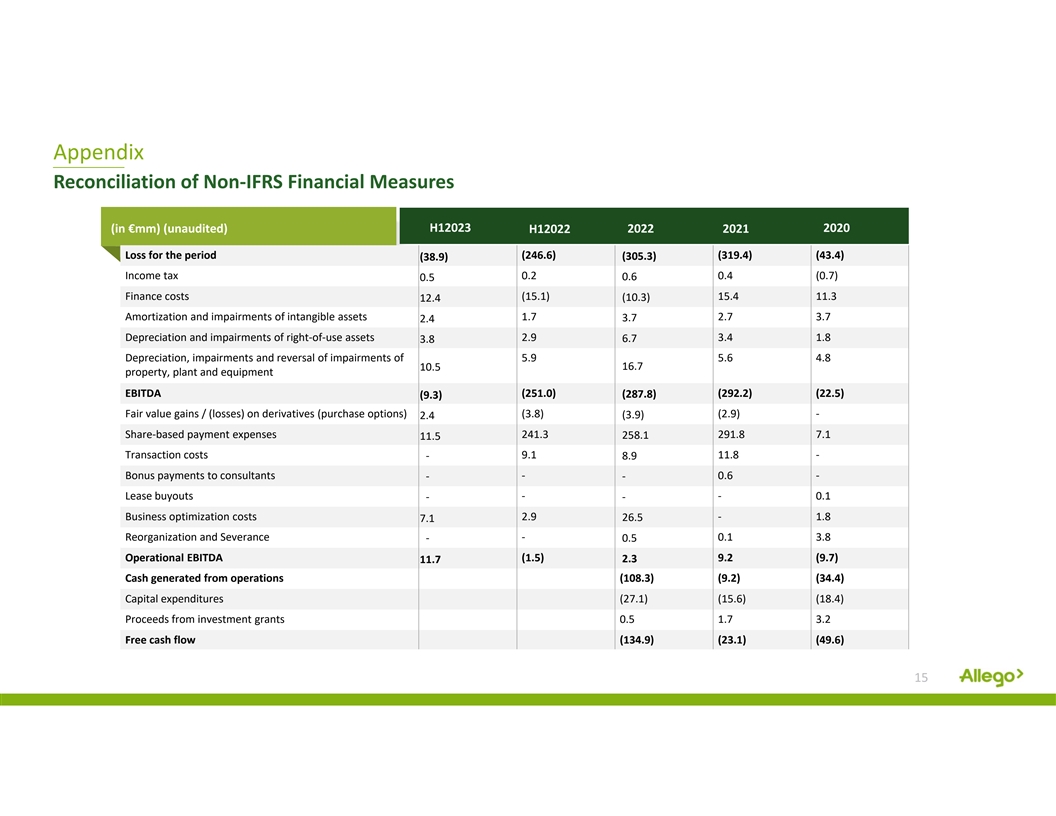
Appendix Reconciliation of Non‐IFRS Financial Measures H12023 2020 (in €mm) (unaudited) H12022 2022 2021 Loss for the period (246.6) (319.4) (43.4) (305.3) (38.9) Income tax 0.2 0.6 0.4 (0.7) 0.5 Finance costs (15.1) 15.4 11.3 12.4 (10.3) Amortization and impairments of intangible assets 1.7 3.7 2.7 3.7 2.4 Depreciation and impairments of right‐of‐use assets 2.9 3.4 1.8 3.8 6.7 Depreciation, impairments and reversal of impairments of 5.9 5.6 4.8 10.5 16.7 property, plant and equipment EBITDA (251.0) (292.2) (22.5) (9.3) (287.8) Fair value gains / (losses) on derivatives (purchase options) (3.8) (2.9) ‐ (3.9) 2.4 Share‐based payment expenses 241.3 258.1 291.8 7.1 11.5 Transaction costs 9.1 11.8 ‐ ‐ 8.9 Bonus payments to consultants ‐ 0.6 ‐ ‐ ‐ Lease buyouts ‐ ‐ 0.1 ‐ ‐ Business optimization costs 2.9 ‐ 1.8 26.5 7.1 Reorganization and Severance ‐ ‐ 0.5 0.1 3.8 Operational EBITDA (1.5) 9.2 (9.7) 2.3 11.7 Cash generated from operations (108.3) (9.2) (34.4) Capital expenditures (27.1) (15.6) (18.4) Proceeds from investment grants 0.5 1.7 3.2 Free cash flow (134.9) (23.1) (49.6) 15