
Exhibit 99.2

Disclaimer All statements other than statements of historical facts contained in this Presentation are forward-looking statements. Allego intends such forward-looking statements to be covered by the safe harbor provisions for forward-looking statements contained in Section 21E of the Securities Exchange Act of 1934 and the Private Securities Litigation Reform Act of 1995. Forward looking statements may generally be identified by the use of words such as “believe,” “may,” “will,” “estimate,” “continue,” “anticipate,” “intend,” “expect,” “should,” “would,” “plan,”, “project,” “forecast,” “predict,” “potential,” “seem,” “seek,” “future,” “outlook,” “target” or other similar expressions (or the negative versions of such words or expressions) that predict or indicate future events or trends or that are not statements of historical matters. These forward-looking statements include, without limitation, Allego’s expectations with respect to future performance and anticipated financial impacts of the business combination. These forward-looking statements involve significant risks and uncertainties that could cause the actual results to differ materially, and potentially adversely, from those expressed or implied in the forward-looking statements. Most of these factors are outside Allego’s control and are difficult to predict. Factors that may cause such differences include, but are not limited to: (i) changes adversely affecting Allego’s business, (ii) the risks associated with vulnerability to industry downturns and regional or national downturns, (iii) fluctuations in Allego’s revenue and operating results, (iv) unfavorable conditions or further disruptions in the capital and credit markets, (v) Allego’s ability to generate cash, service indebtedness and incur additional indebtedness, (vi) competition from existing and new competitors, (vii) the growth of the electric vehicle market, (viii) Allego’s ability to integrate any businesses it may acquire, (ix) Allego’s ability to recruit and retain experienced personnel, (x) risks related to legal proceedings or claims, including liability claims, (xi) Allego’s dependence on third-party contractors to provide various services, (xii) Allego’s ability to obtain additional capital on commercially reasonable terms, (xiii) the impact of COVID-19, including COVID-19 related supply chain disruptions and expense increases, (xiv) general economic or political conditions, including the armed conflict in Ukraine and (xv) other factors detailed under the section entitled “Item 3.D. Risk Factors” of Allego’s Annual Report on Form 20-F for the year ended December 31, 2021 and in Allego’s other filings with the U.S. Securities and Exchange Commission (“SEC.”) The foregoing list of factors is not exclusive. If any of these risks materialize or Allego’s assumptions prove incorrect, actual results could differ materially from the results implied by these forward-looking statements. There may be additional risks that Allego presently does not know or that Allego currently believes are immaterial that could also cause actual results to differ from those contained in the forward-looking statements. In addition, forward-looking statements reflect Allego’s expectations, plans or forecasts of future events and views as of the date of this Presentation. Allego anticipates that subsequent events and developments will cause Allego’s assessments to change. However, while Allego may elect to update these forward-looking statements at some point in the future, Allego specifically disclaims any obligation to do so, unless required by applicable law. These forward looking statements should not be relied upon as representing Allego’s assessments as of any date subsequent to the date of this Presentation. Accordingly, undue reliance should not be placed upon the forward-looking statements. INDUSTRY AND MARKET DATA Although all information and opinions expressed in this Presentation, including market data and other statistical information, were obtained from sources believed to be reliable and are included in good faith, Allego has not independently verified the information and makes no representation or warranty, express or implied, as to its accuracy or completeness. Some data is also based on the good faith estimates of Allego, which is derived from its review of internal sources as well as the independent sources described above. This Presentation contains preliminary information only, is subject to change at any time and, is not, and should not be assumed to be, complete or to constitute all the information necessary to adequately make an informed decision regarding your engagement with Allego. FINANCIAL INFORMATION; NON-IFRS FINANCIAL MEASURES Some of the financial information and data contained in this Presentation, such as EBITDA, Operational EBITDA and free cash flow, have not been prepared in accordance with Dutch generally accepted accounting principles, United States generally accepted accounting principles or the International Financial Reporting Standards (“IFRS”). We define (i) EBITDA as earnings before interest expense, taxes, depreciation and amortization, (ii) Operational EBITDA as EBITDA further adjusted for reorganization costs, certain business optimization costs, lease buyouts, anticipated board compensation costs and director and officer insurance costs and anticipated transaction costs and (iii) free cash flow as net cash flow from operating activities less capital expenditures. Allego believes that the use of these non-IFRS measures of financial results provide useful information to management and investors regarding certain financial and business trends relating to Allego’s financial condition and results of operations. Allego’s management uses these non-IFRS measures for trend analyses, for purposes of determining management incentive compensation and for budgeting and planning purposes. Allego believes that the use of these non-IFRS financial measures provides an additional tool for investors to use in evaluating projected operating results and trends and in comparing Allego’s financial measures with other similar companies, many of which present similar non-IFRS financial measures to investors. Management does not consider these non-IFRS measures in isolation or as an alternative to financial measures determined in accordance with IFRS. The principal limitation of these non-IFRS financial measures is that they exclude significant expenses and income that are required by IFRS to be recorded in Allego’s financial statements. In addition, they are subject to inherent limitations as they reflect the exercise of judgments by management about which expense and income are excluded or included in determining these non-IFRS financial measures. In order to compensate for these limitations, management presents non-IFRS financial measures in connection with IFRS results and reconciliations to the most directly comparable IFRS measure are provided in the Appendix to this Presentation. Allego’s financial results are denominated in euros. TRADEMARKS AND TRADE NAMES Allego owns or has rights to various trademarks, service marks and trade names that it uses in connection with the operation of its businesses. This Presentation also contains trademarks, service marks and trade names of third parties, which are the property of their respective owners. The use or display of third parties’ trademarks, service marks, trade names or products in this Presentation is not intended to, and does not imply, a relationship with Allego or an endorsement or sponsorship by or of Allego. Solely for convenience, the trademarks, service marks and trade names referred to in this Presentation may appear with the ®, TM or SM symbols, but such references are not intended to indicate, in any way, that Allego will not assert, to the fullest extent under applicable law, its rights or the right of the applicable licensor to these trademarks, service marks and trade names. CERTAIN RISKS RELATED TO ALLEGO All references to the “Company,” “Allego,” “we,” “us,” or “our” in this Presentation refer to the business of Allego. The risks presented below are certain of the general risks related to Company’s business, industry and ownership structure and are not exhaustive. The list below is qualified in its entirety by disclosures contained in Allego’s Annual Report on Form 20-F for the year ended December 31, 2021, as filed with the SEC. These risks speak only as of the date of the Presentation, and we have no obligation to update the disclosures contained herein. The risks highlighted in future filings with the SEC may differ significantly from and will be more extensive than those presented below. Allego is an early stage company with a history of operating losses, and expects to incur significant expenses and continuing losses for the near term and medium term. Allego has experienced rapid growth and expects to invest substantially in growth for the foreseeable future. If it fails to manage growth effectively, its business, operating results and financial condition could be adversely affected. Allego’s forecasts and projections are based upon assumptions, analyses and internal estimates developed by Allego’s management. If these assumptions, analyses or estimates prove to be incorrect or inaccurate, Allego’s actual operating results may differ adversely and materially from those forecasted or projected. Allego’s estimates of market opportunity and forecasts of market growth may prove to be inaccurate, and Allego’s growth and success is highly correlated with and dependent upon the continuing rapid adoption of EVs. Allego currently faces competition from a number of companies and expects to face significant competition in the future as the market for EV charging develops. Allego may need to raise additional funds or debt and these funds may not be available when needed. If Allego fails to offer high-quality support to its customers and fails to maintain the availability of its charging points, its business and reputation may suffer. Allego relies on a limited number of suppliers and manufacturers for its hardware and equipment and charging stations. A loss of any of these partners or issues in their manufacturing and supply processes could negatively affect its business. Allego’s business is subject to risks associated with the price of electricity, which may hamper its profitability and growth. Allego is dependent on the availability of electricity at its current and future charging sites. Delays and/or other restrictions on the availability of electricity would adversely affect Allego’s business and results of operations. Allego’s EV driver base will depend upon the effective operation of Allego’s EVCloudTM platform and its applications with mobile service providers, firmware from hardware manufacturers, mobile operating systems, networks and standards that Allego does not control. If Allego is unable to attract and retain key employees and hire qualified management, technical, engineering and sales personnel, its ability to compete and successfully grow its business would be harmed. Allego is expanding operations in many countries in Europe, which will expose it to additional tax, compliance, market, local rules and other risks. Members of Allego’s management have limited experience in operating a public company. New alternative fuel technologies may negatively impact the growth of the EV market and thus the demand for Allego’s charging stations and services. The European EV market currently benefits from the availability of rebates, scrappage schemes, tax credits and other financial incentives from governments to offset and incentivize the purchase of EVs. The reduction, modification, or elimination of such benefits could cause reduced demand for EVs and EV charging, which would adversely affect Allego’s financial results. Allego’s business may be adversely affected if it is unable to protect its technology and intellectual property from unauthorized use by third-parties. Allego’s technology could have undetected defects, errors or bugs in hardware or software which could reduce market adoption, damage its reputation with current or prospective customers, and/or expose it to product liability and other claims that could materially and adversely affect its business. The exclusive forum clause set forth in Allego’s Warrant Agreement may have the effect of limiting an investor’s rights to bring legal action against Allego and could limit the investor’s ability to obtain a favorable judicial forum for disputes with us. Future sales, or the perception of future sales, of Allego’s ordinary shares and warrants by Allego or selling securityholders, including Madeline, could cause the market price for Allego’s ordinary shares and warrants to decline significantly. Madeleine owns a significant amount of Allego’s voting shares and its interests may conflict with those of other shareholders.

FINANCIAL PROFILE OPERATIONAL PROFILE Key Highlights of 2021 ~75% increase in charging revenue (in euros) sold driven by higher utilization rates Signed signature partnerships with Carrefour and Nissan amongst others €9.2mm OPERATIONAL EBITDA1 €86.3mm REVENUE €138 million raised in growth capital – first-of-its-kind project finance vehicle for EV charging infrastructure 10.7% in operational EBITDA margin – up +200bps ahead of plan 83GWh of 100% renewable energy delivered in 2021, up 77% from 2020 Delivered 258 million green miles Geographic footprint across Europe with an 80% average recurring rate per month 787 FAST & ULTRA-FAST CHARGING SITES 7.6% UTILIZATION RATE2 Source: Company information 1 Operational EBITDA adjusted for reorganization costs, certain business optimization costs, lease buyouts, anticipated board compensation costs and director and officer insurance costs and transaction costs; 2 In December 2021 and for ultra-fast chargers. Excludes all non-operational sites and sites that became operational in 2021 €319.7mm Net Loss
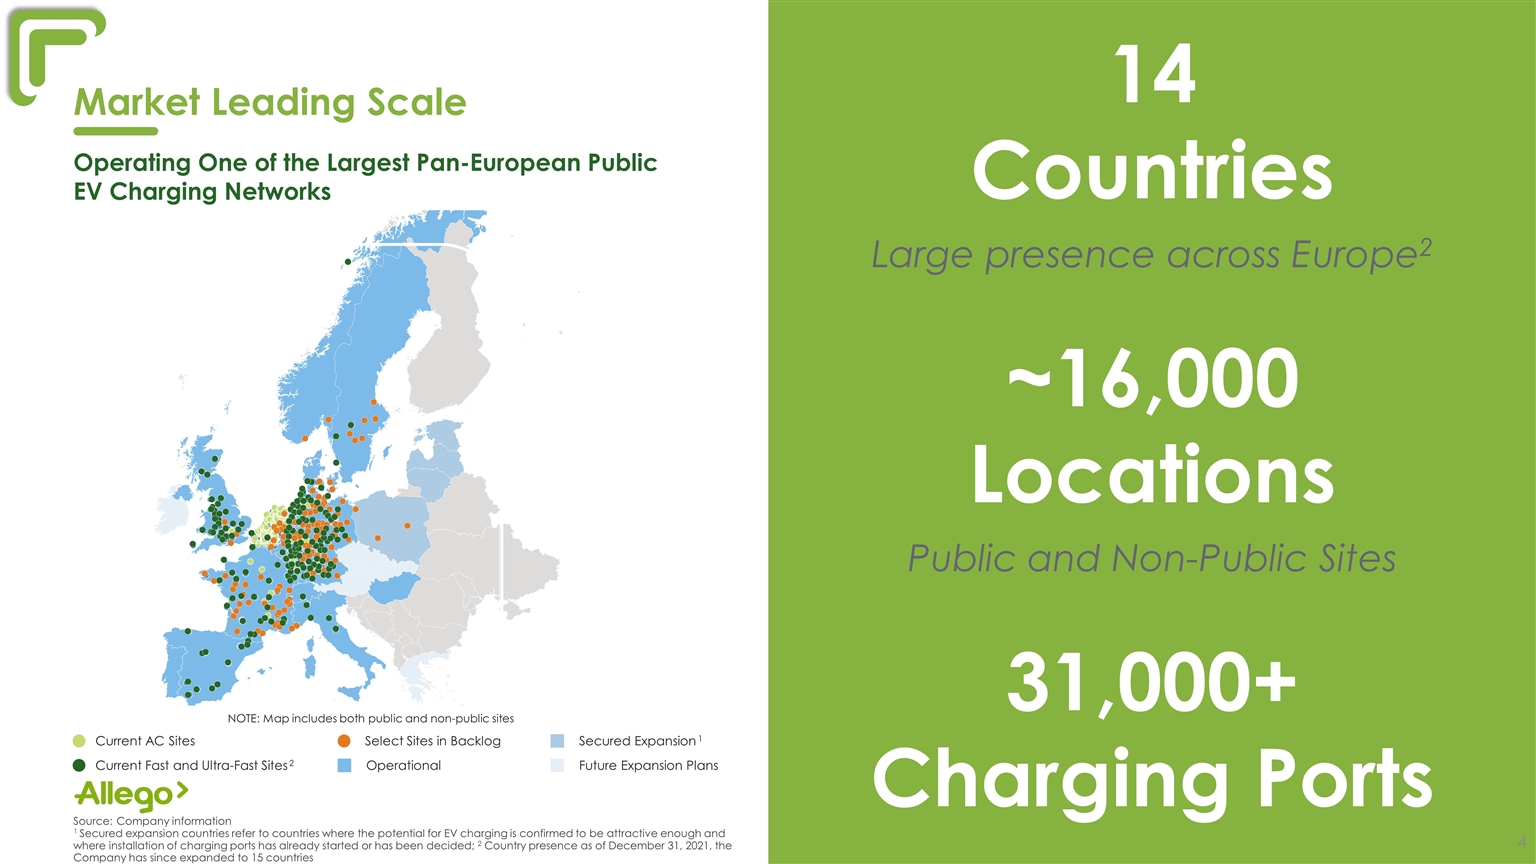
14 Countries Large presence across Europe2 ~16,000 Locations Public and Non-Public Sites Source:Company information 1 Secured expansion countries refer to countries where the potential for EV charging is confirmed to be attractive enough and where installation of charging ports has already started or has been decided; 2 Country presence as of December 31, 2021, the Company has since expanded to 15 countries Market Leading Scale 31,000+ Charging Ports Secured Expansion 1 Future Expansion Plans Current AC Sites Current Fast and Ultra-Fast Sites 2 Operational Select Sites in Backlog NOTE: Map includes both public and non-public sites Operating One of the Largest Pan-European Public EV Charging Networks
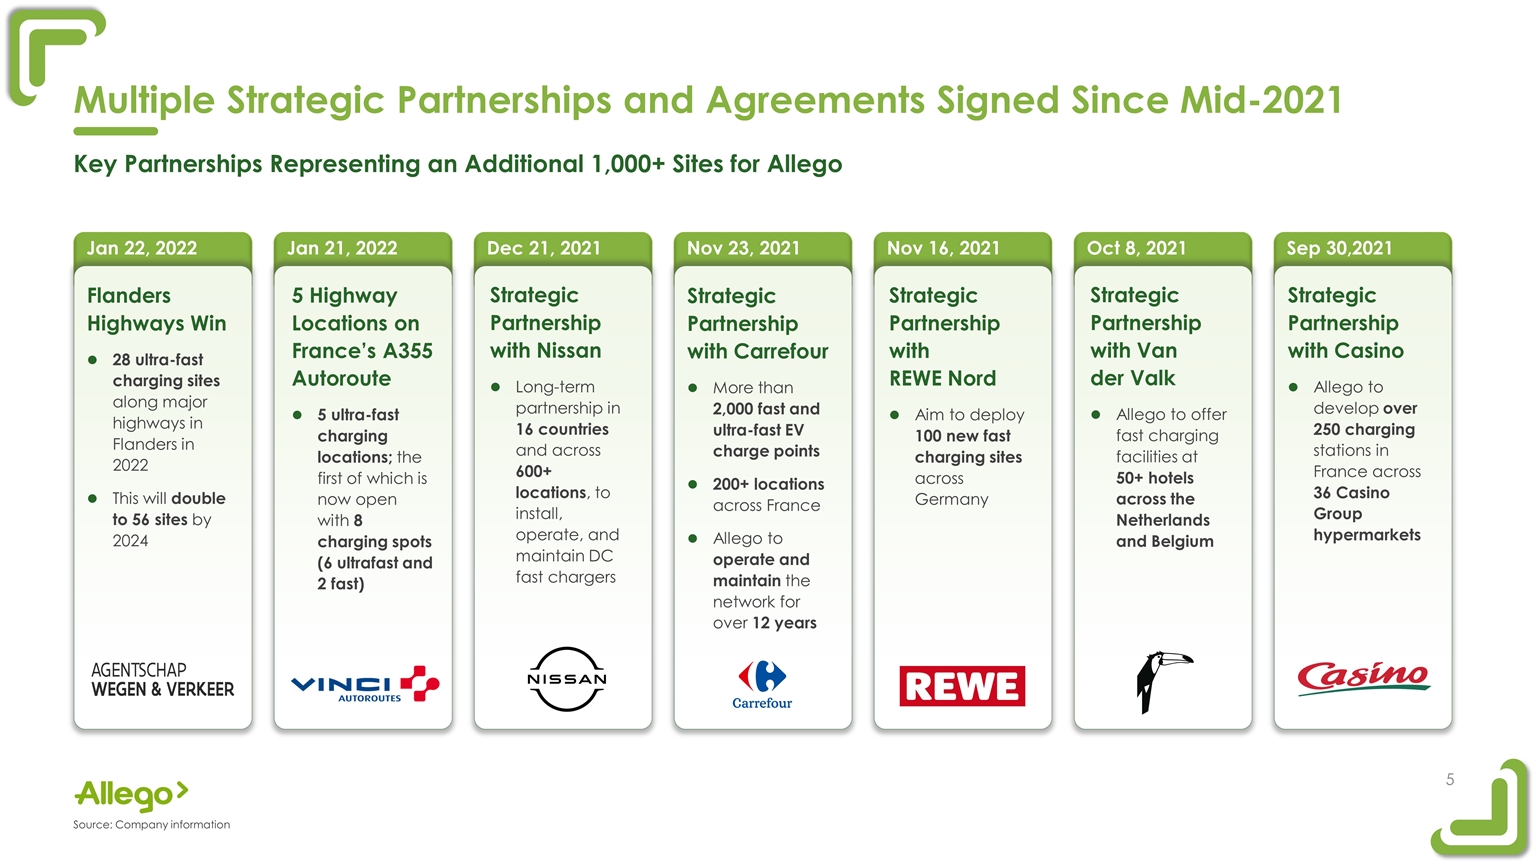
Nov 16, 2021 Oct 8, 2021 Sep 30,2021 Jan 21, 2022 Jan 22, 2022 Multiple Strategic Partnerships and Agreements Signed Since Mid-2021 Source: Company information Flanders Highways Win 28 ultra-fast charging sites along major highways in Flanders in 2022 This will double to 56 sites by 2024 5 Highway Locations on France’s A355 Autoroute 5 ultra-fast charging locations; the first of which is now open with 8 charging spots (6 ultrafast and 2 fast) Strategic Partnership with REWE Nord Aim to deploy 100 new fast charging sites across Germany Strategic Partnership with Van der Valk Allego to offer fast charging facilities at 50+ hotels across the Netherlands and Belgium Strategic Partnership with Casino Allego to develop over 250 charging stations in France across 36 Casino Group hypermarkets Key Partnerships Representing an Additional 1,000+ Sites for Allego Dec 21, 2021 Strategic Partnership with Nissan Long-term partnership in 16 countries and across 600+ locations, to install, operate, and maintain DC fast chargers Nov 23, 2021 Strategic Partnership with Carrefour More than 2,000 fast and ultra-fast EV charge points 200+ locations across France Allego to operate and maintain the network for over 12 years
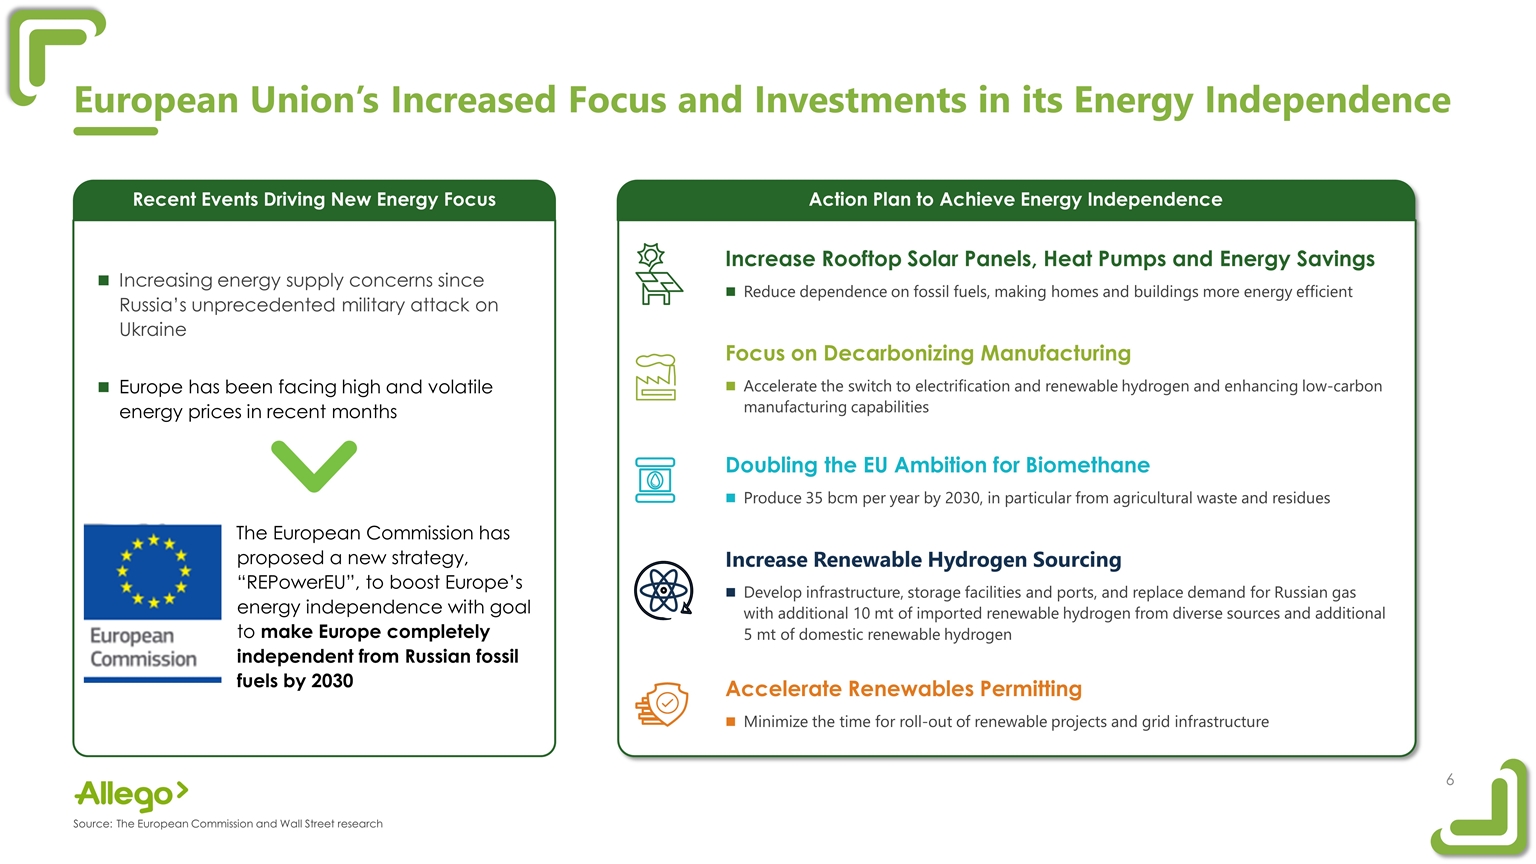
Action Plan to Achieve Energy Independence Source:The European Commission and Wall Street research Increase Rooftop Solar Panels, Heat Pumps and Energy Savings Reduce dependence on fossil fuels, making homes and buildings more energy efficient Focus on Decarbonizing Manufacturing Accelerate the switch to electrification and renewable hydrogen and enhancing low-carbon manufacturing capabilities Doubling the EU Ambition for Biomethane Produce 35 bcm per year by 2030, in particular from agricultural waste and residues Increase Renewable Hydrogen Sourcing Develop infrastructure, storage facilities and ports, and replace demand for Russian gas with additional 10 mt of imported renewable hydrogen from diverse sources and additional 5 mt of domestic renewable hydrogen Accelerate Renewables Permitting Minimize the time for roll-out of renewable projects and grid infrastructure European Union’s Increased Focus and Investments in its Energy Independence Recent Events Driving New Energy Focus Increasing energy supply concerns since Russia’s unprecedented military attack on Ukraine Europe has been facing high and volatile energy prices in recent months The European Commission has proposed a new strategy, “REPowerEU”, to boost Europe’s energy independence with goal to make Europe completely independent from Russian fossil fuels by 2030
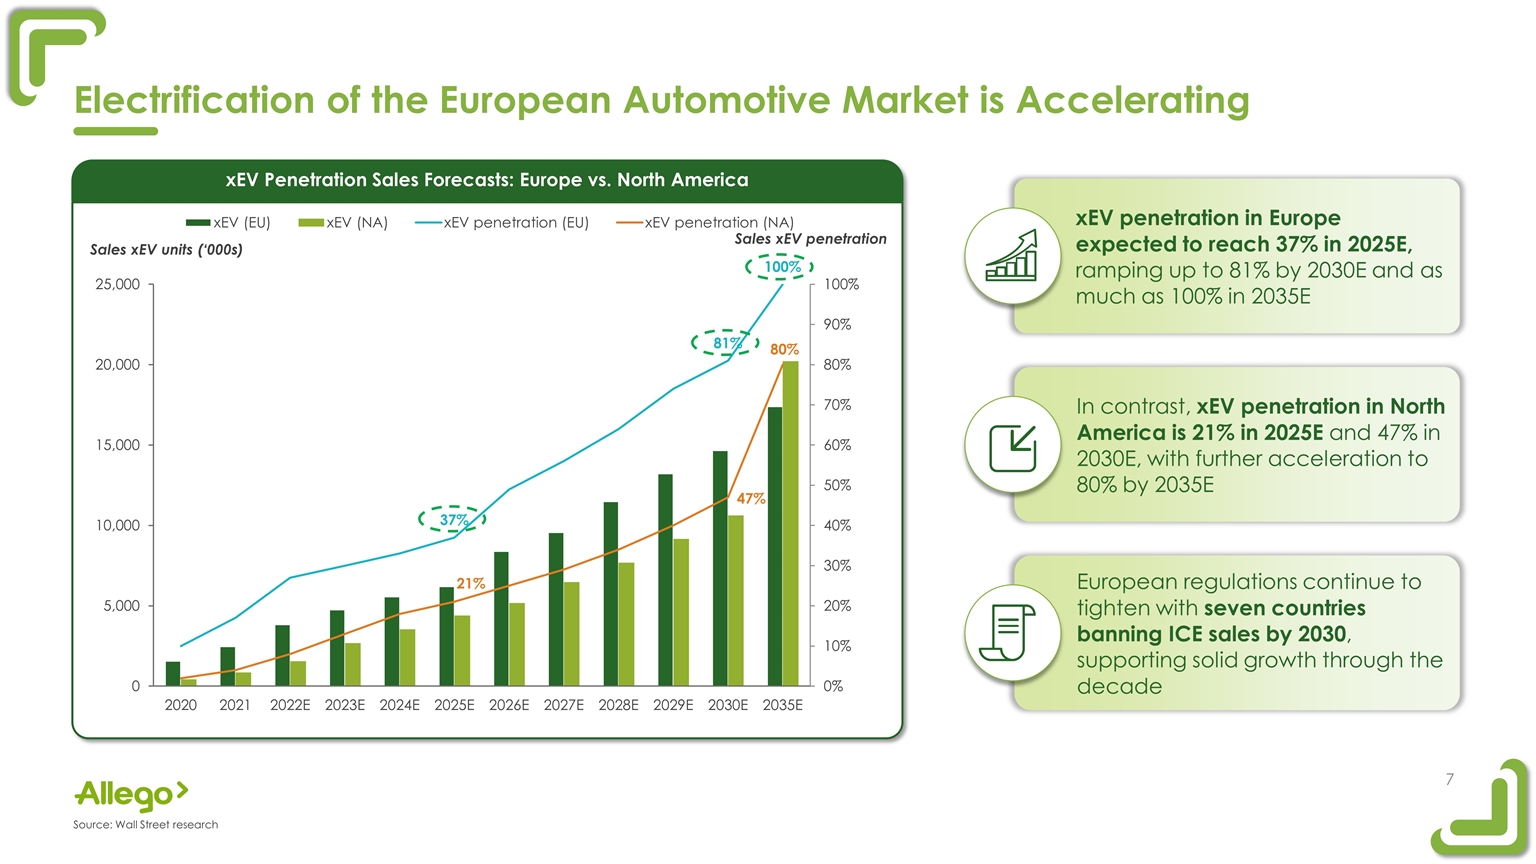
xEV Penetration Sales Forecasts: Europe vs. North America Electrification of the European Automotive Market is Accelerating Sales xEV units (‘000s) Sales xEV penetration …and Europe is expected to produce nearly 25mm more BEVs in the coming years as compared to the U.S. Cumulative BEV production by region (2020-2029E) (in mm LV BEV sold) Source: Wall Street research xEV penetration in Europe expected to reach 37% in 2025E, ramping up to 81% by 2030E and as much as 100% in 2035E European regulations continue to tighten with seven countries banning ICE sales by 2030, supporting solid growth through the decade In contrast, xEV penetration in North America is 21% in 2025E and 47% in 2030E, with further acceleration to 80% by 2035E
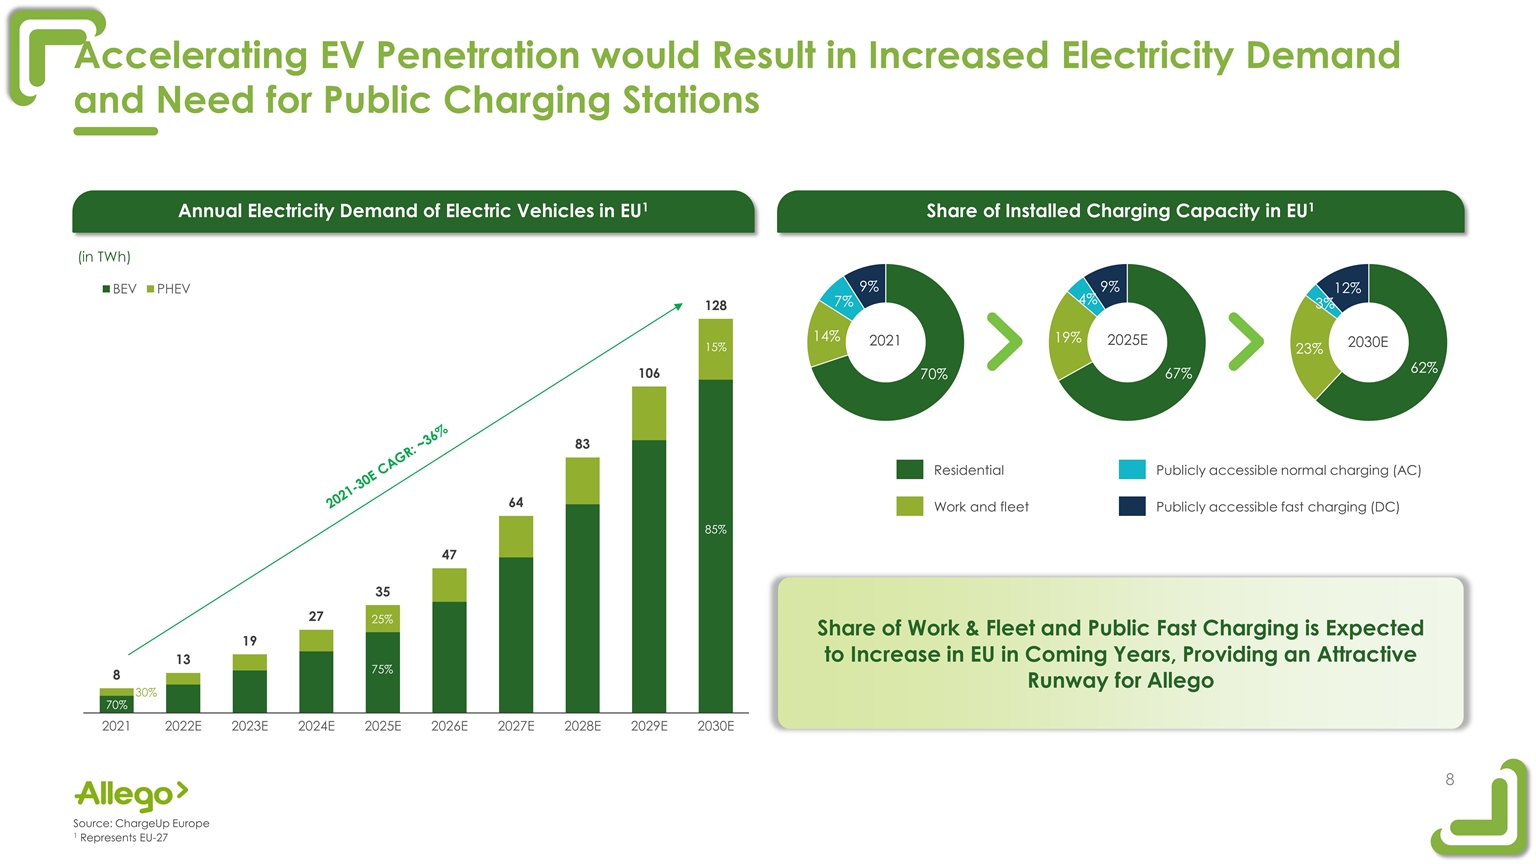
Accelerating EV Penetration would Result in Increased Electricity Demand and Need for Public Charging Stations 3 5 7 10 13 16 19 22 26 30 2% 2% 5% 1% 8% 80% 4% 15% 79% 81% 12% 11% (€ in billions) Source: ChargeUp Europe 1 Represents EU-27 5.0 5.9 6.7 7.3 8.6 9.7 10.9 11.3 13.5 15.4 Required Capital Expenditure for Charging Infrastructure in EU1 (in TWh) 70% 30% 75% 25% 85% 15% Annual Electricity Demand of Electric Vehicles in EU1 2021-30E CAGR: ~36% CAGR: ~13% CAGR: ~28% Charging point stock Share of Installed Charging Capacity in EU1 2021 2030E 2025E Residential Work and fleet Publicly accessible normal charging (AC) Publicly accessible fast charging (DC) Share of Work & Fleet and Public Fast Charging is Expected to Increase in EU in Coming Years, Providing an Attractive Runway for Allego 8
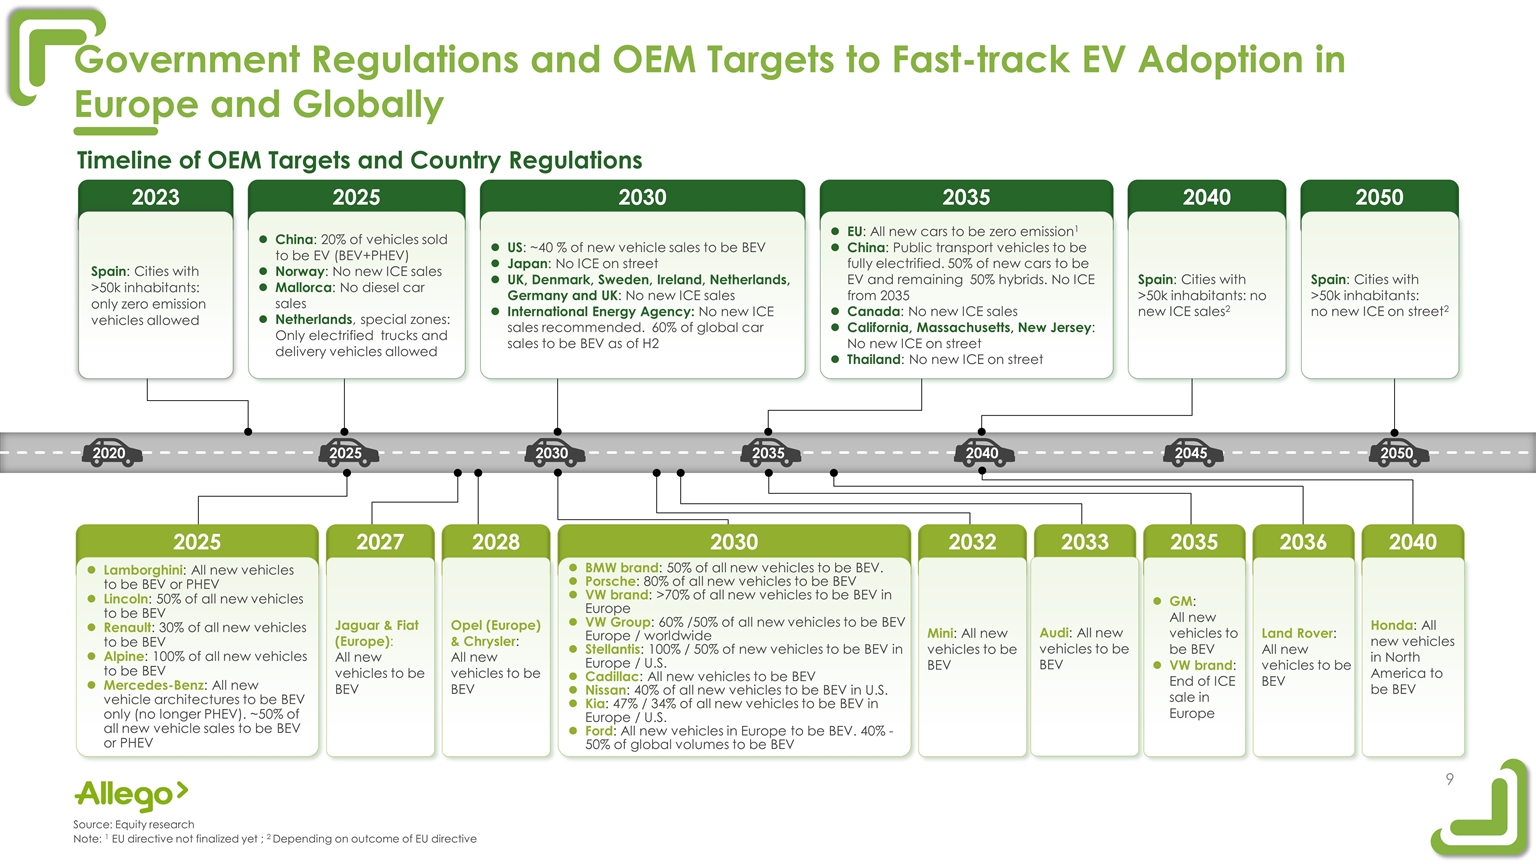
2025 2030 2035 2040 2050 2023 Spain: Cities with >50k inhabitants: only zero emission vehicles allowed China: 20% of vehicles sold to be EV (BEV+PHEV) Norway: No new ICE sales Mallorca: No diesel car sales Netherlands, special zones: Only electrified trucks and delivery vehicles allowed US: ~40 % of new vehicle sales to be BEV Japan: No ICE on street UK, Denmark, Sweden, Ireland, Netherlands, Germany and UK: No new ICE sales International Energy Agency: No new ICE sales recommended. 60% of global car sales to be BEV as of H2 EU: All new cars to be zero emission1 China: Public transport vehicles to be fully electrified. 50% of new cars to be EV and remaining 50% hybrids. No ICE from 2035 Canada: No new ICE sales California, Massachusetts, New Jersey: No new ICE on street Thailand: No new ICE on street Spain: Cities with >50k inhabitants: no new ICE sales2 Spain: Cities with >50k inhabitants: no new ICE on street2 Timeline of OEM Targets and Country Regulations Source: Equity research Note: 1 EU directive not finalized yet ; 2 Depending on outcome of EU directive Government Regulations and OEM Targets to Fast-track EV Adoption in Europe and Globally 2033 2035 2036 2040 2032 2025 2027 2028 2030 Lamborghini: All new vehicles to be BEV or PHEV Lincoln: 50% of all new vehicles to be BEV Renault: 30% of all new vehicles to be BEV Alpine: 100% of all new vehicles to be BEV Mercedes-Benz: All new vehicle architectures to be BEV only (no longer PHEV). ~50% of all new vehicle sales to be BEV or PHEV Jaguar & Fiat (Europe): All new vehicles to be BEV Opel (Europe) & Chrysler: All new vehicles to be BEV BMW brand: 50% of all new vehicles to be BEV. Porsche: 80% of all new vehicles to be BEV VW brand: >70% of all new vehicles to be BEV in Europe VW Group: 60% /50% of all new vehicles to be BEV Europe / worldwide Stellantis: 100% / 50% of new vehicles to be BEV in Europe / U.S. Cadillac: All new vehicles to be BEV Nissan: 40% of all new vehicles to be BEV in U.S. Kia: 47% / 34% of all new vehicles to be BEV in Europe / U.S. Ford: All new vehicles in Europe to be BEV. 40% -50% of global volumes to be BEV GM: All new vehicles to be BEV VW brand: End of ICE sale in Europe Land Rover: All new vehicles to be BEV Honda: All new vehicles in North America to be BEV Mini: All new vehicles to be BEV 2025 2020 2030 2035 2040 2045 2050 Audi: All new vehicles to be BEV
Financial and Operational Performance Update
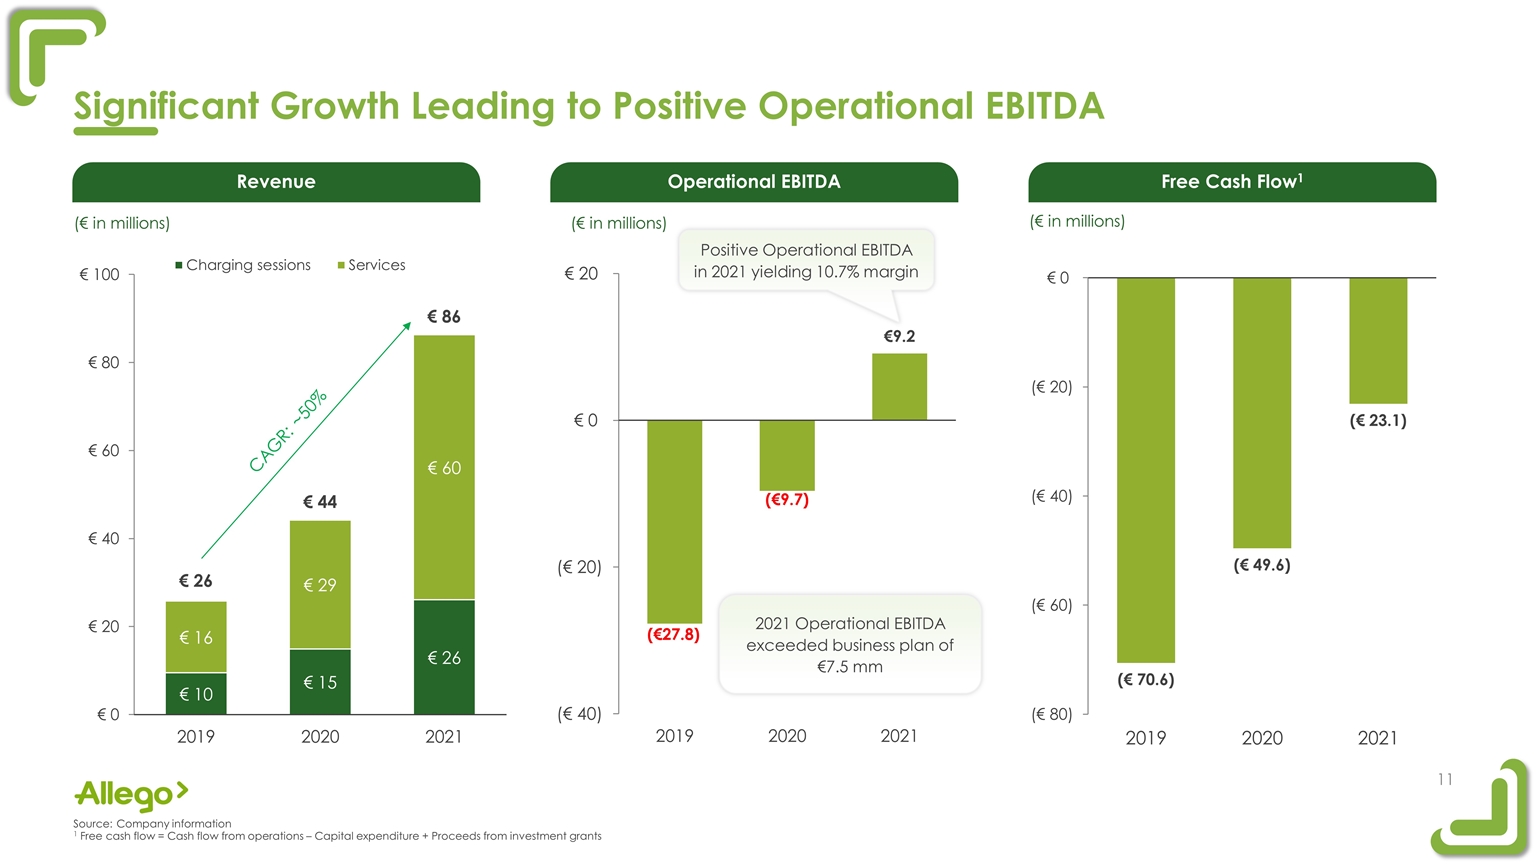
(€ in millions) P6 Chargepoint CAGR: ~50% (€ in millions) Positive Operational EBITDA in 2021 yielding 10.7% margin 2021 Operational EBITDA exceeded business plan of €7.5 mm Revenue Operational EBITDA Free Cash Flow1 Significant Growth Leading to Positive Operational EBITDA (€ in millions) Source:Company information 1 Free cash flow = Cash flow from operations – Capital expenditure + Proceeds from investment grants
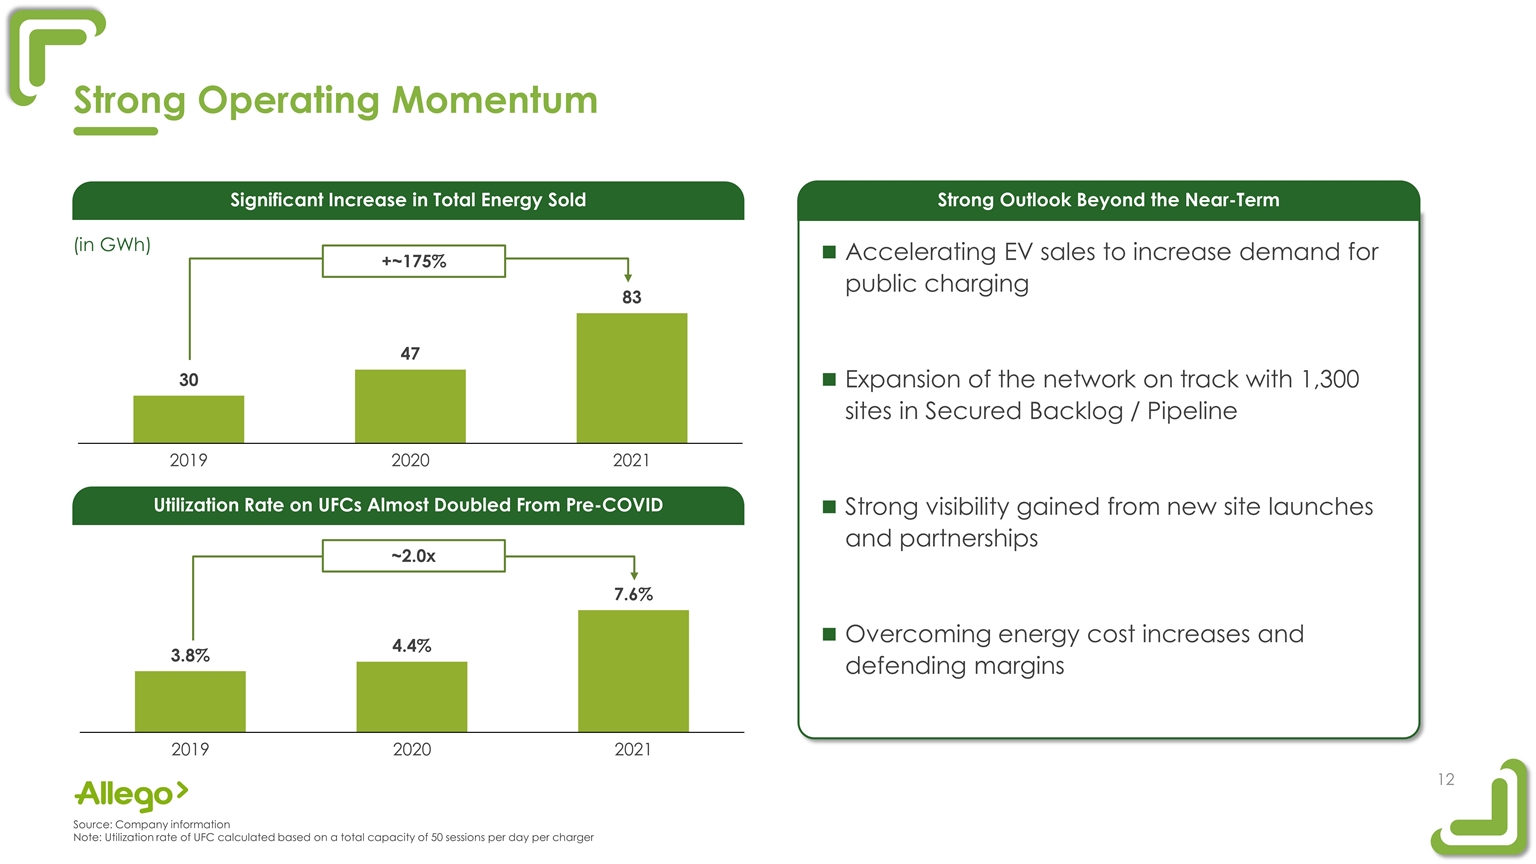
~2.0x +~175% (in GWh) Accelerating EV sales to increase demand for public charging Expansion of the network on track with 1,300 sites in Secured Backlog / Pipeline Strong visibility gained from new site launches and partnerships Overcoming energy cost increases and defending margins Strong Operating Momentum Utilization Rate on UFCs Almost Doubled From Pre-COVID Significant Increase in Total Energy Sold Strong Outlook Beyond the Near-Term Source: Company information Note: Utilization rate of UFC calculated based on a total capacity of 50 sessions per day per charger
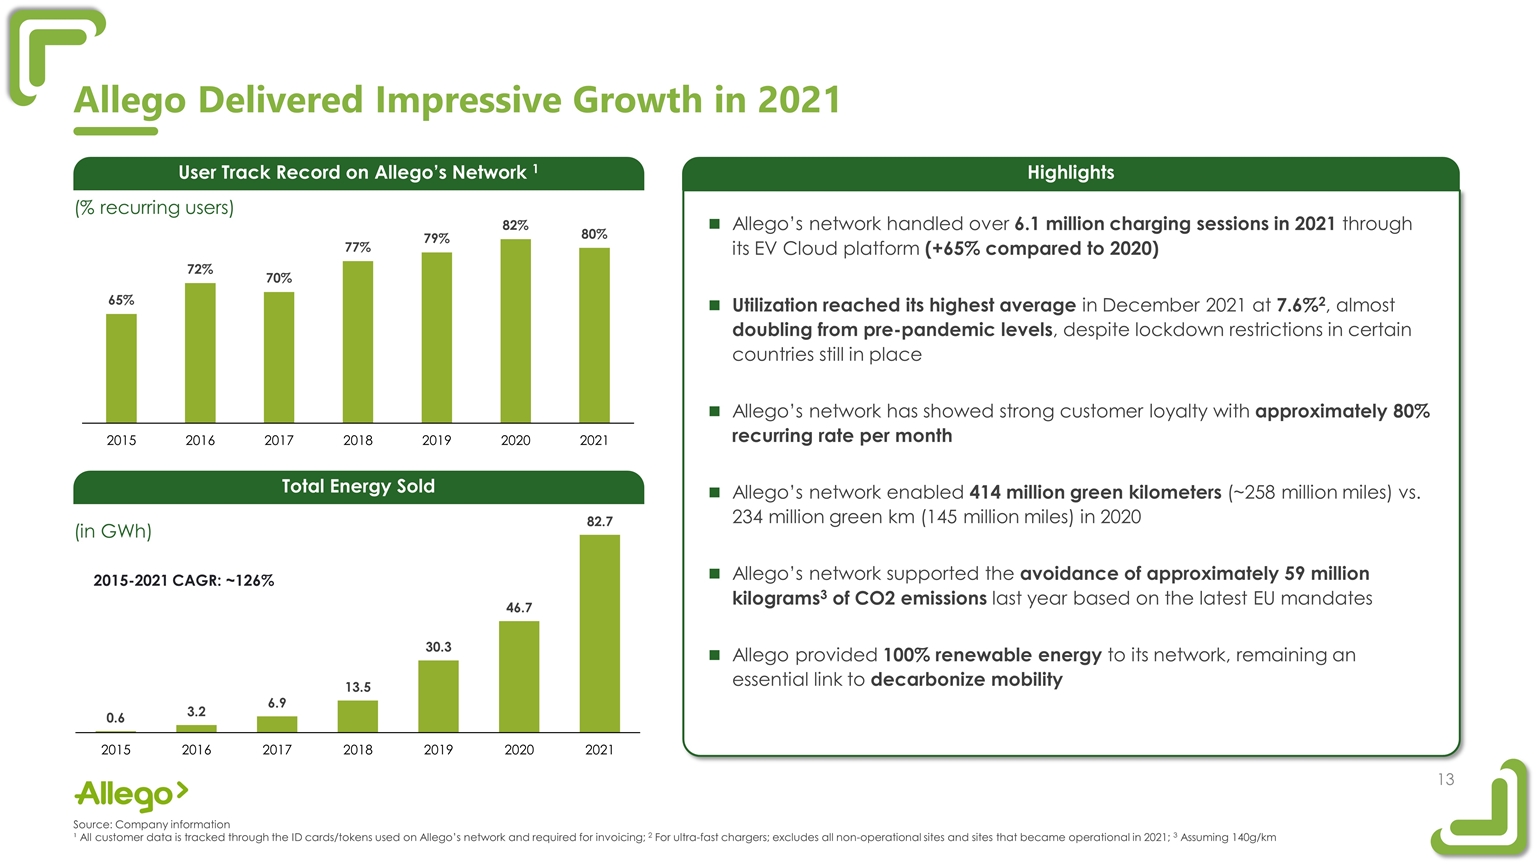
(% recurring users) (in GWh) Source:Company information. Unique users defined as customers who have charged on Allego’s network at least once. All customer data is tracked through the ID cards/tokens used on Allego’s network and required for invoicing. Assuming 140g/km. Allego’s network handled over 6.1 million charging sessions in 2021 through its EV Cloud platform (+65% compared to 2020) Utilization reached its highest average in December 2021 at 7.6%2, almost doubling from pre-pandemic levels, despite lockdown restrictions in certain countries still in place Allego’s network has showed strong customer loyalty with approximately 80% recurring rate per month Allego’s network enabled 414 million green kilometers (~258 million miles) vs. 234 million green km (145 million miles) in 2020 Allego’s network supported the avoidance of approximately 59 million kilograms3 of CO2 emissions last year based on the latest EU mandates Allego provided 100% renewable energy to its network, remaining an essential link to decarbonize mobility 2015-2021 CAGR: ~126% Allego Delivered Impressive Growth in 2021 User Track Record on Allego’s Network 1 Total Energy Sold Highlights Source: Company information ¹ All customer data is tracked through the ID cards/tokens used on Allego’s network and required for invoicing; 2 For ultra-fast chargers; excludes all non-operational sites and sites that became operational in 2021; 3 Assuming 140g/km
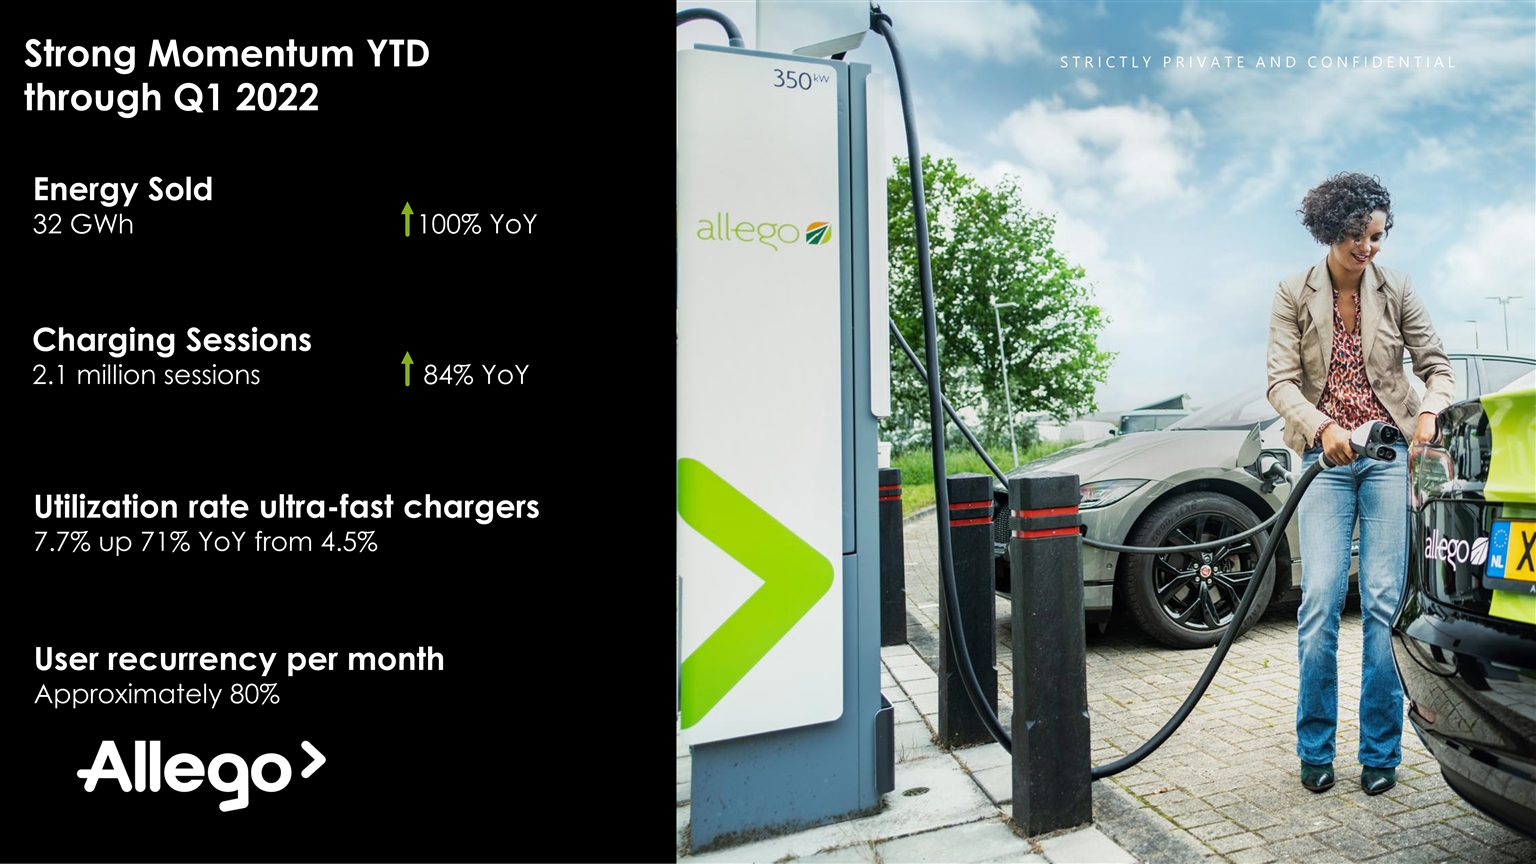
Strong Momentum YTD through Q1 2022 Energy Sold 32 GWh 100% YoY Charging Sessions 2.1 million sessions 84% YoY Utilization rate ultra-fast chargers 7.7% up 71% YoY from 4.5% User recurrency per month Approximately 80%
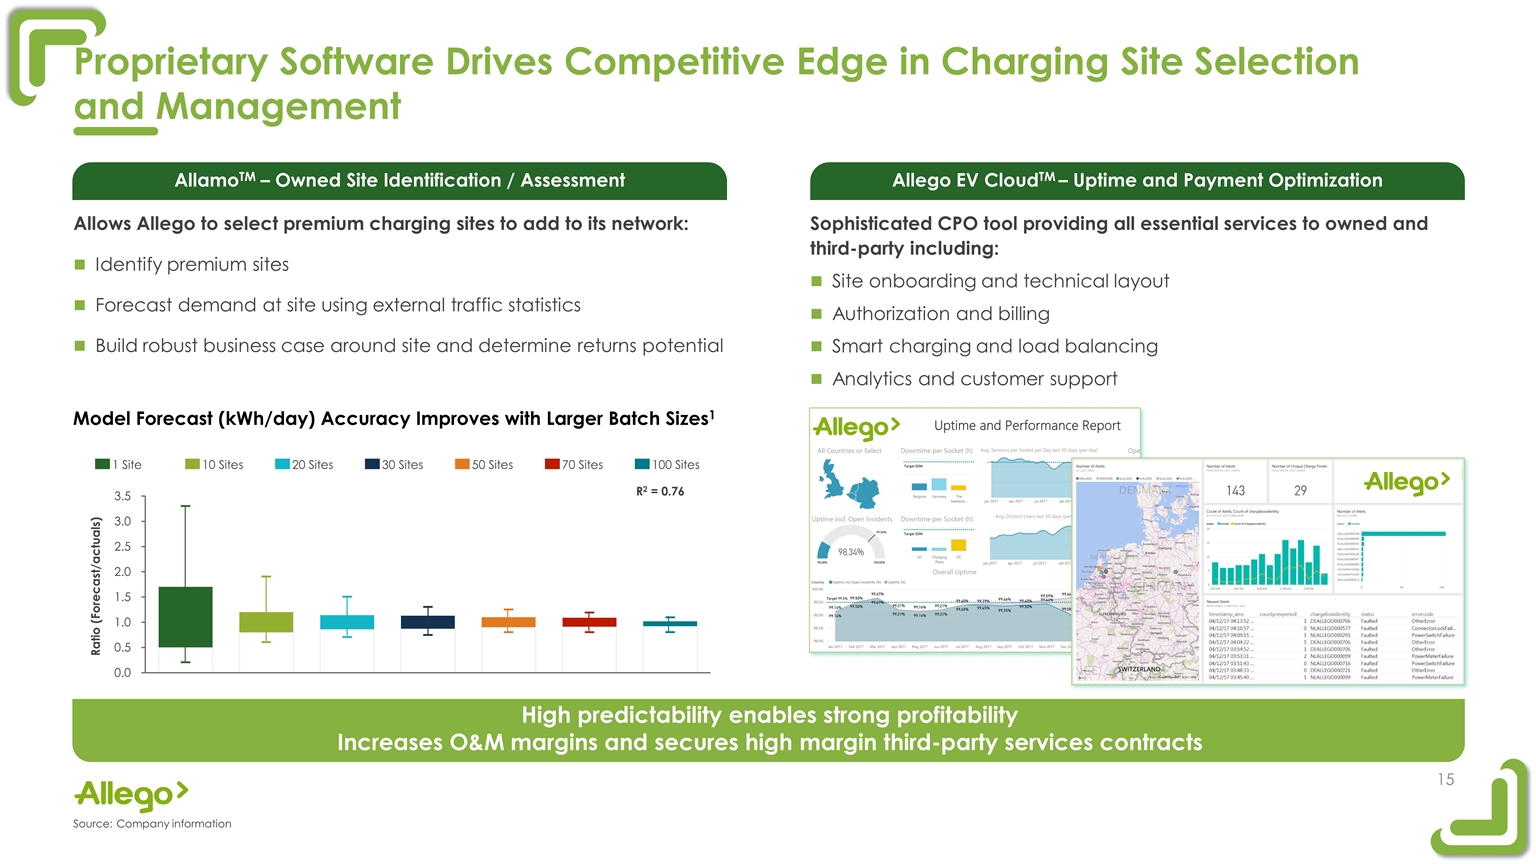
Proprietary Software Drives Competitive Edge in Charging Site Selection and Management Model Forecast (kWh/day) Accuracy Improves with Larger Batch Sizes1 Allows Allego to select premium charging sites to add to its network: Identify premium sites Forecast demand at site using external traffic statistics Build robust business case around site and determine returns potential 1 Site 10 Sites 20 Sites 30 Sites 50 Sites 70 Sites 100 Sites R2 = 0.76 Sophisticated CPO tool providing all essential services to owned and third-party including: Site onboarding and technical layout Authorization and billing Smart charging and load balancing Analytics and customer support AllamoTM – Owned Site Identification / Assessment Allego EV CloudTM – Uptime and Payment Optimization High predictability enables strong profitability Increases O&M margins and secures high margin third-party services contracts Source:Company information
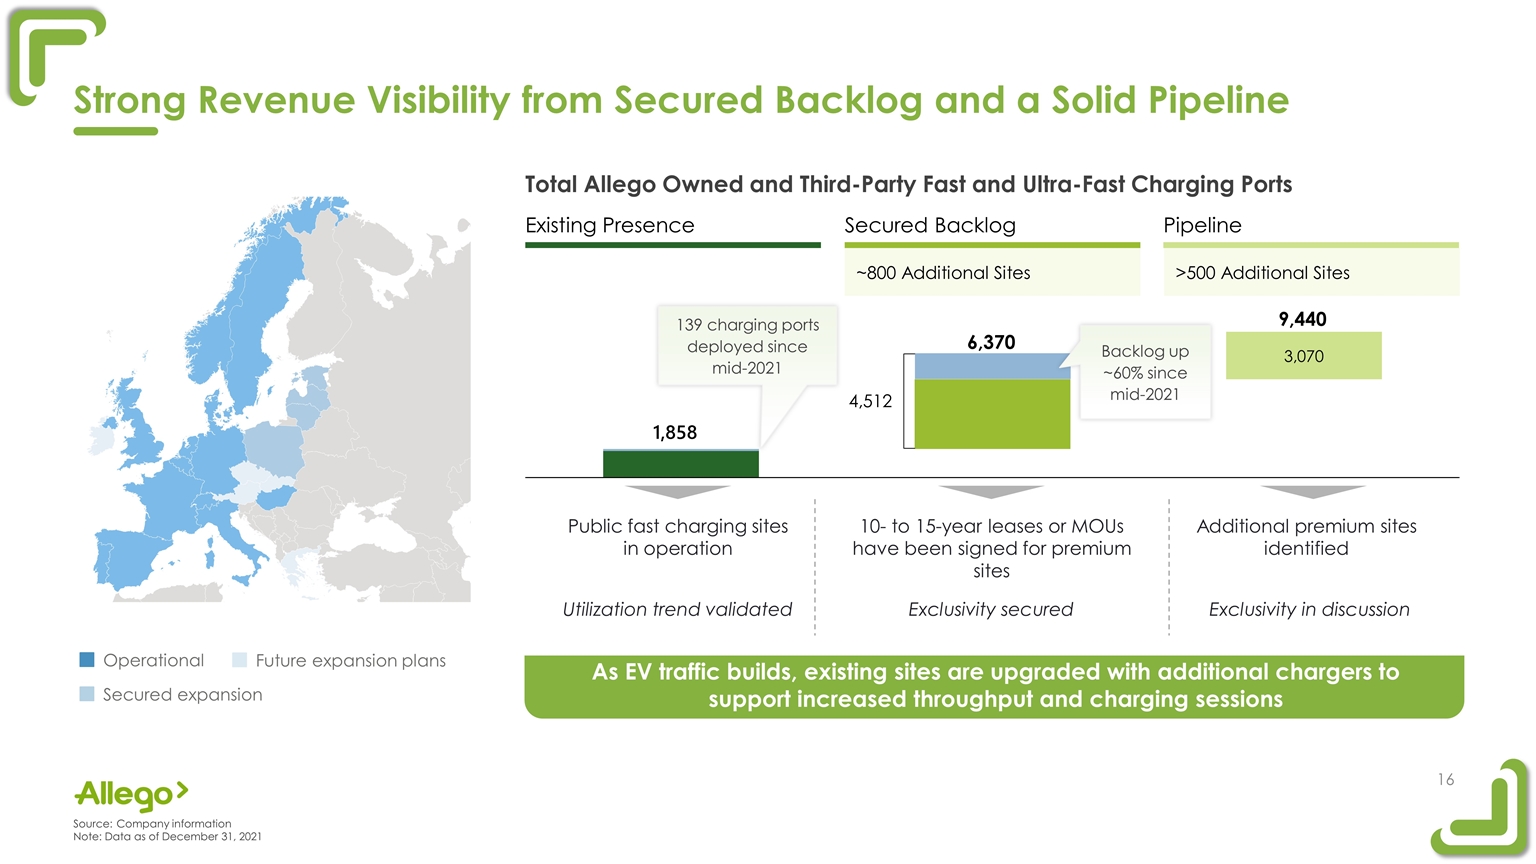
Strong Revenue Visibility from Secured Backlog and a Solid Pipeline Public fast charging sites in operation 10- to 15-year leases or MOUs have been signed for premium sites Additional premium sites identified ~800 Additional Sites >500 Additional Sites Existing Presence Secured Backlog Pipeline 6,370 4,512 9,440 Backlog up ~60% since mid-2021 139 charging ports deployed since mid-2021 Operational Secured expansion Future expansion plans Source:Company information Note: Data as of December 31, 2021 As EV traffic builds, existing sites are upgraded with additional chargers to support increased throughput and charging sessions Total Allego Owned and Third-Party Fast and Ultra-Fast Charging Ports Exclusivity in discussion Exclusivity secured Utilization trend validated
Appendix
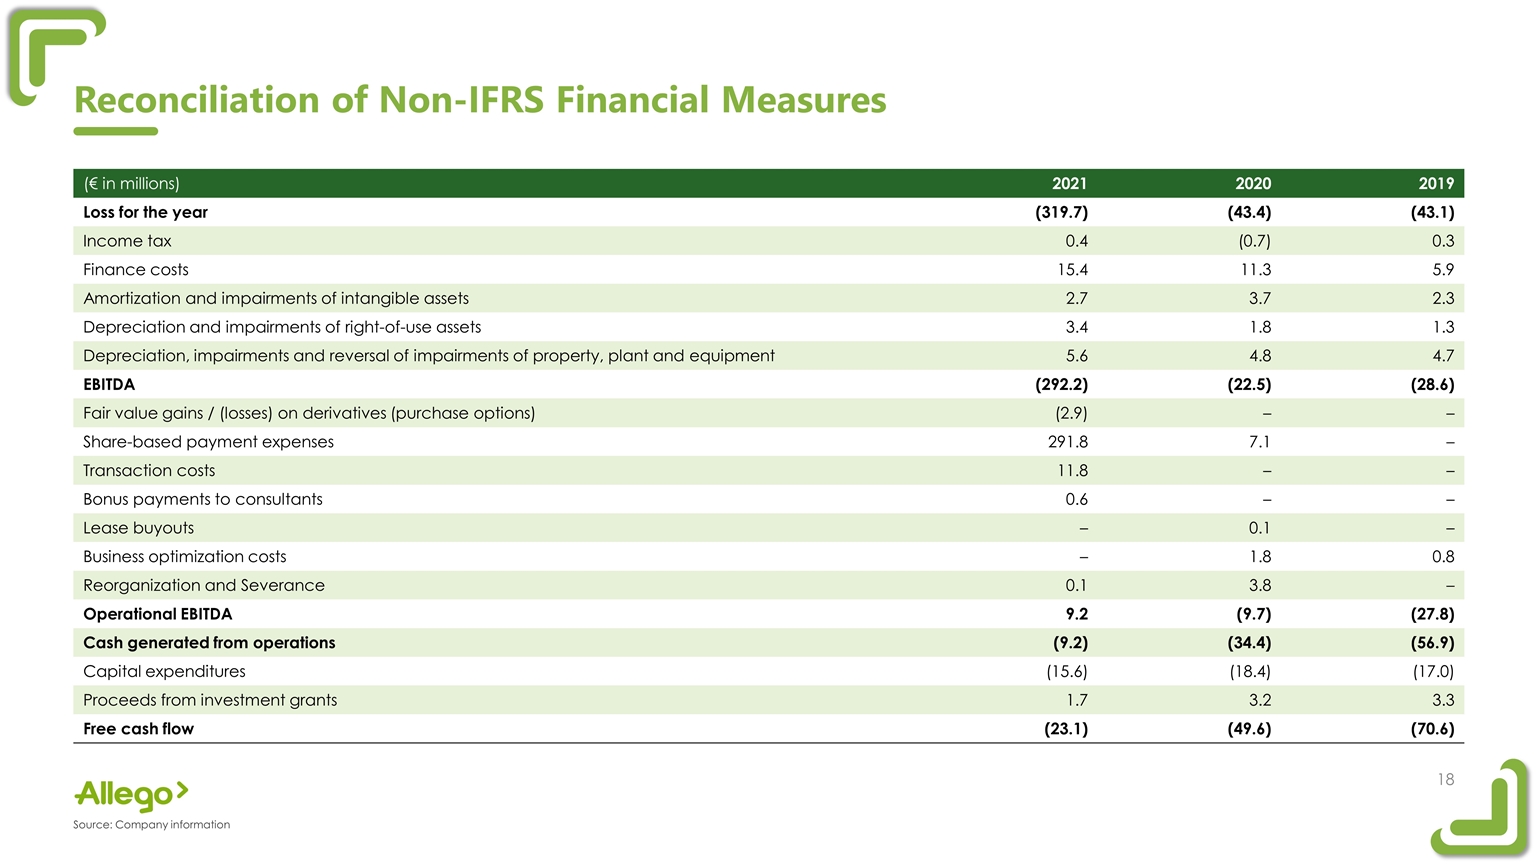
Reconciliation of Non-IFRS Financial Measures Source: Company information (€ in millions) 2021 2020 2019 Loss for the year (319.7) (43.4) (43.1) Income tax 0.4 (0.7) 0.3 Finance costs 15.4 11.3 5.9 Amortization and impairments of intangible assets 2.7 3.7 2.3 Depreciation and impairments of right-of-use assets 3.4 1.8 1.3 Depreciation, impairments and reversal of impairments of property, plant and equipment 5.6 4.8 4.7 EBITDA (292.2) (22.5) (28.6) Fair value gains / (losses) on derivatives (purchase options) (2.9) – – Share-based payment expenses 291.8 7.1 – Transaction costs 11.8 – – Bonus payments to consultants 0.6 – – Lease buyouts – 0.1 – Business optimization costs – 1.8 0.8 Reorganization and Severance 0.1 3.8 – Operational EBITDA 9.2 (9.7) (27.8) Cash generated from operations (9.2) (34.4) (56.9) Capital expenditures (15.6) (18.4) (17.0) Proceeds from investment grants 1.7 3.2 3.3 Free cash flow (23.1) (49.6) (70.6)